

For all the talk of racing getting faster in recent years, there was one strange anomaly in the sport's record books. Stage 4 of the 1999 Tour de France, with an average speed of 50.356 km/h, was still the fastest in the race's history.
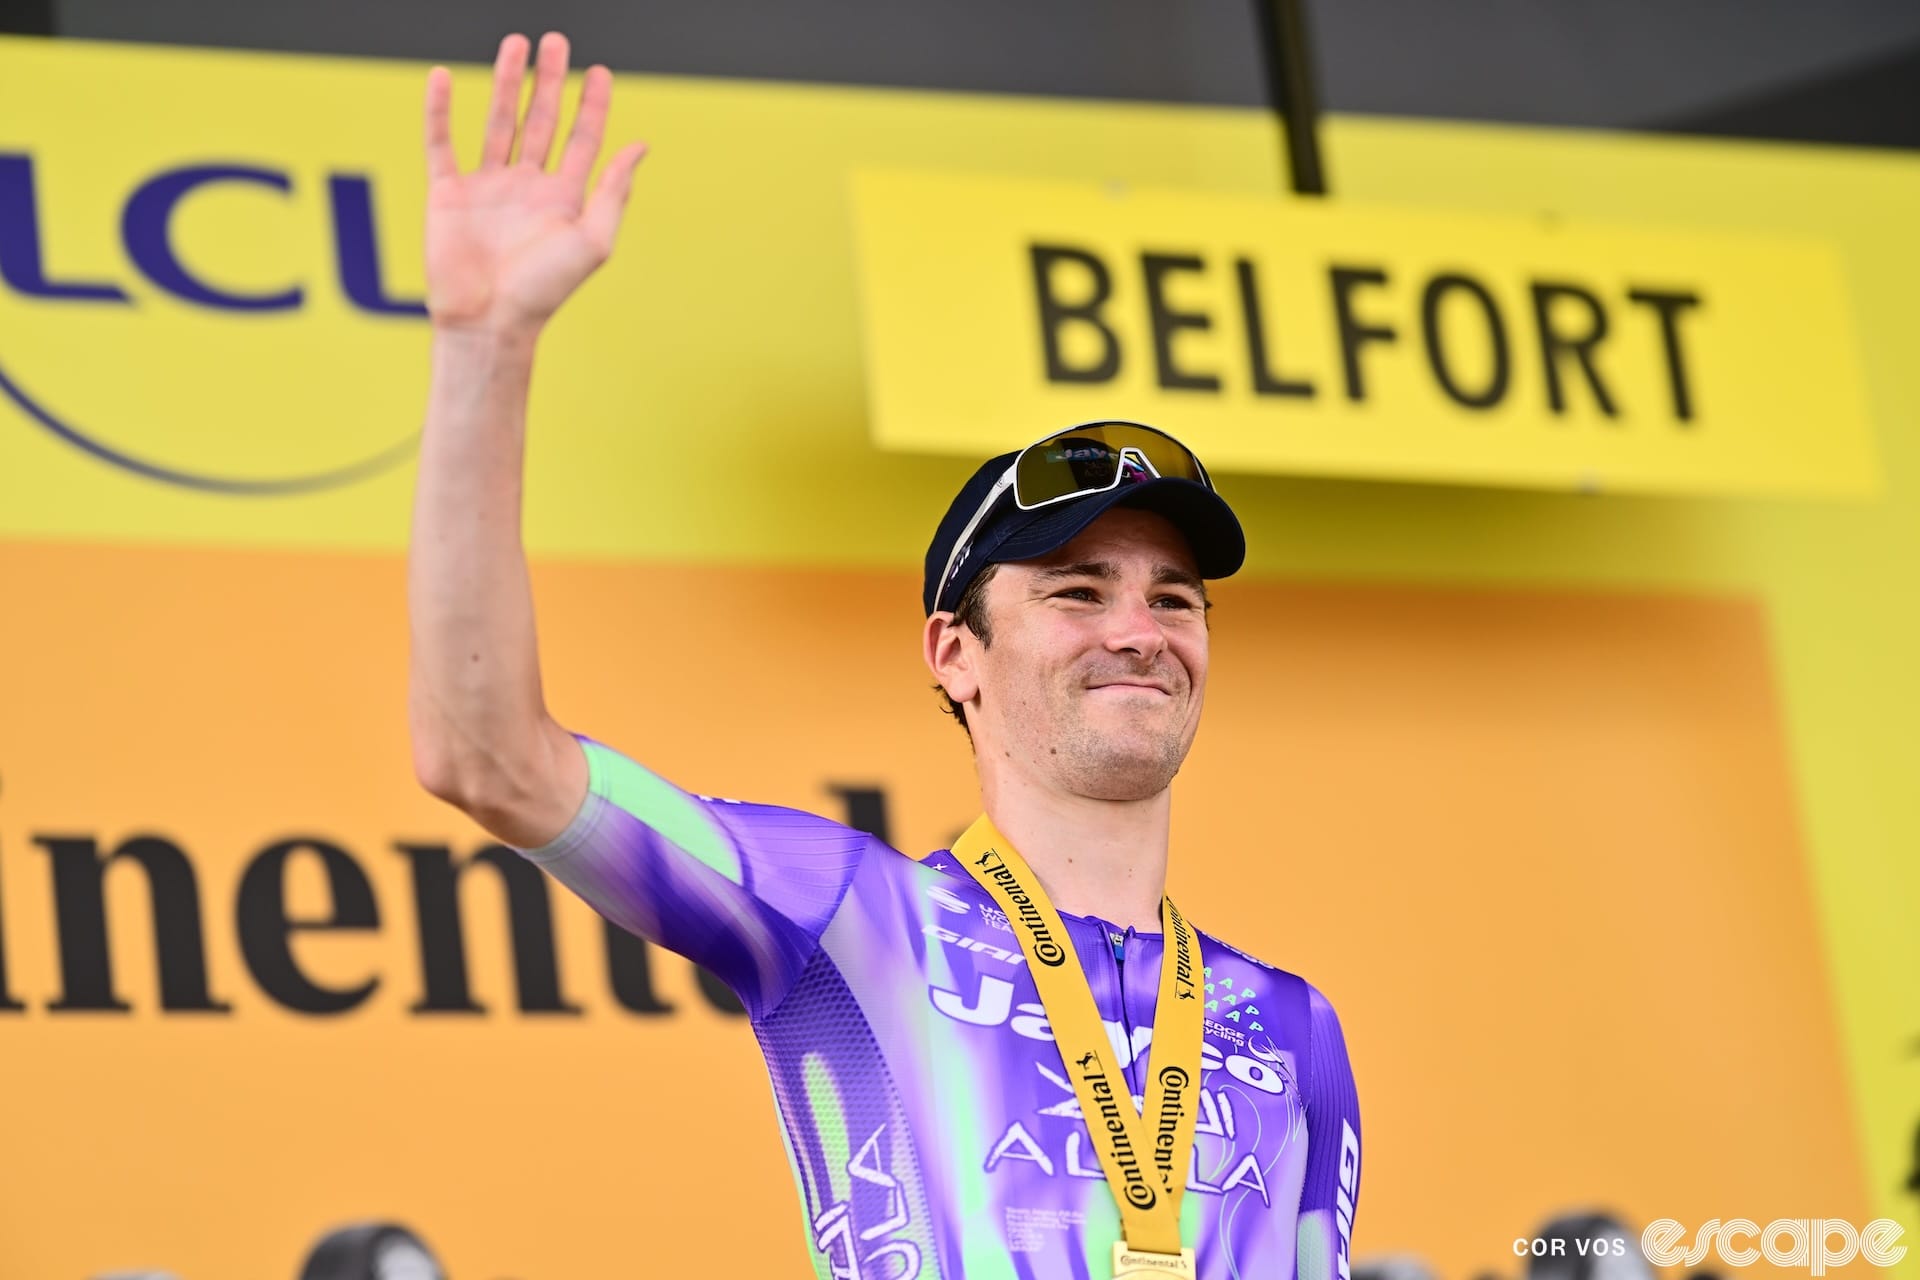
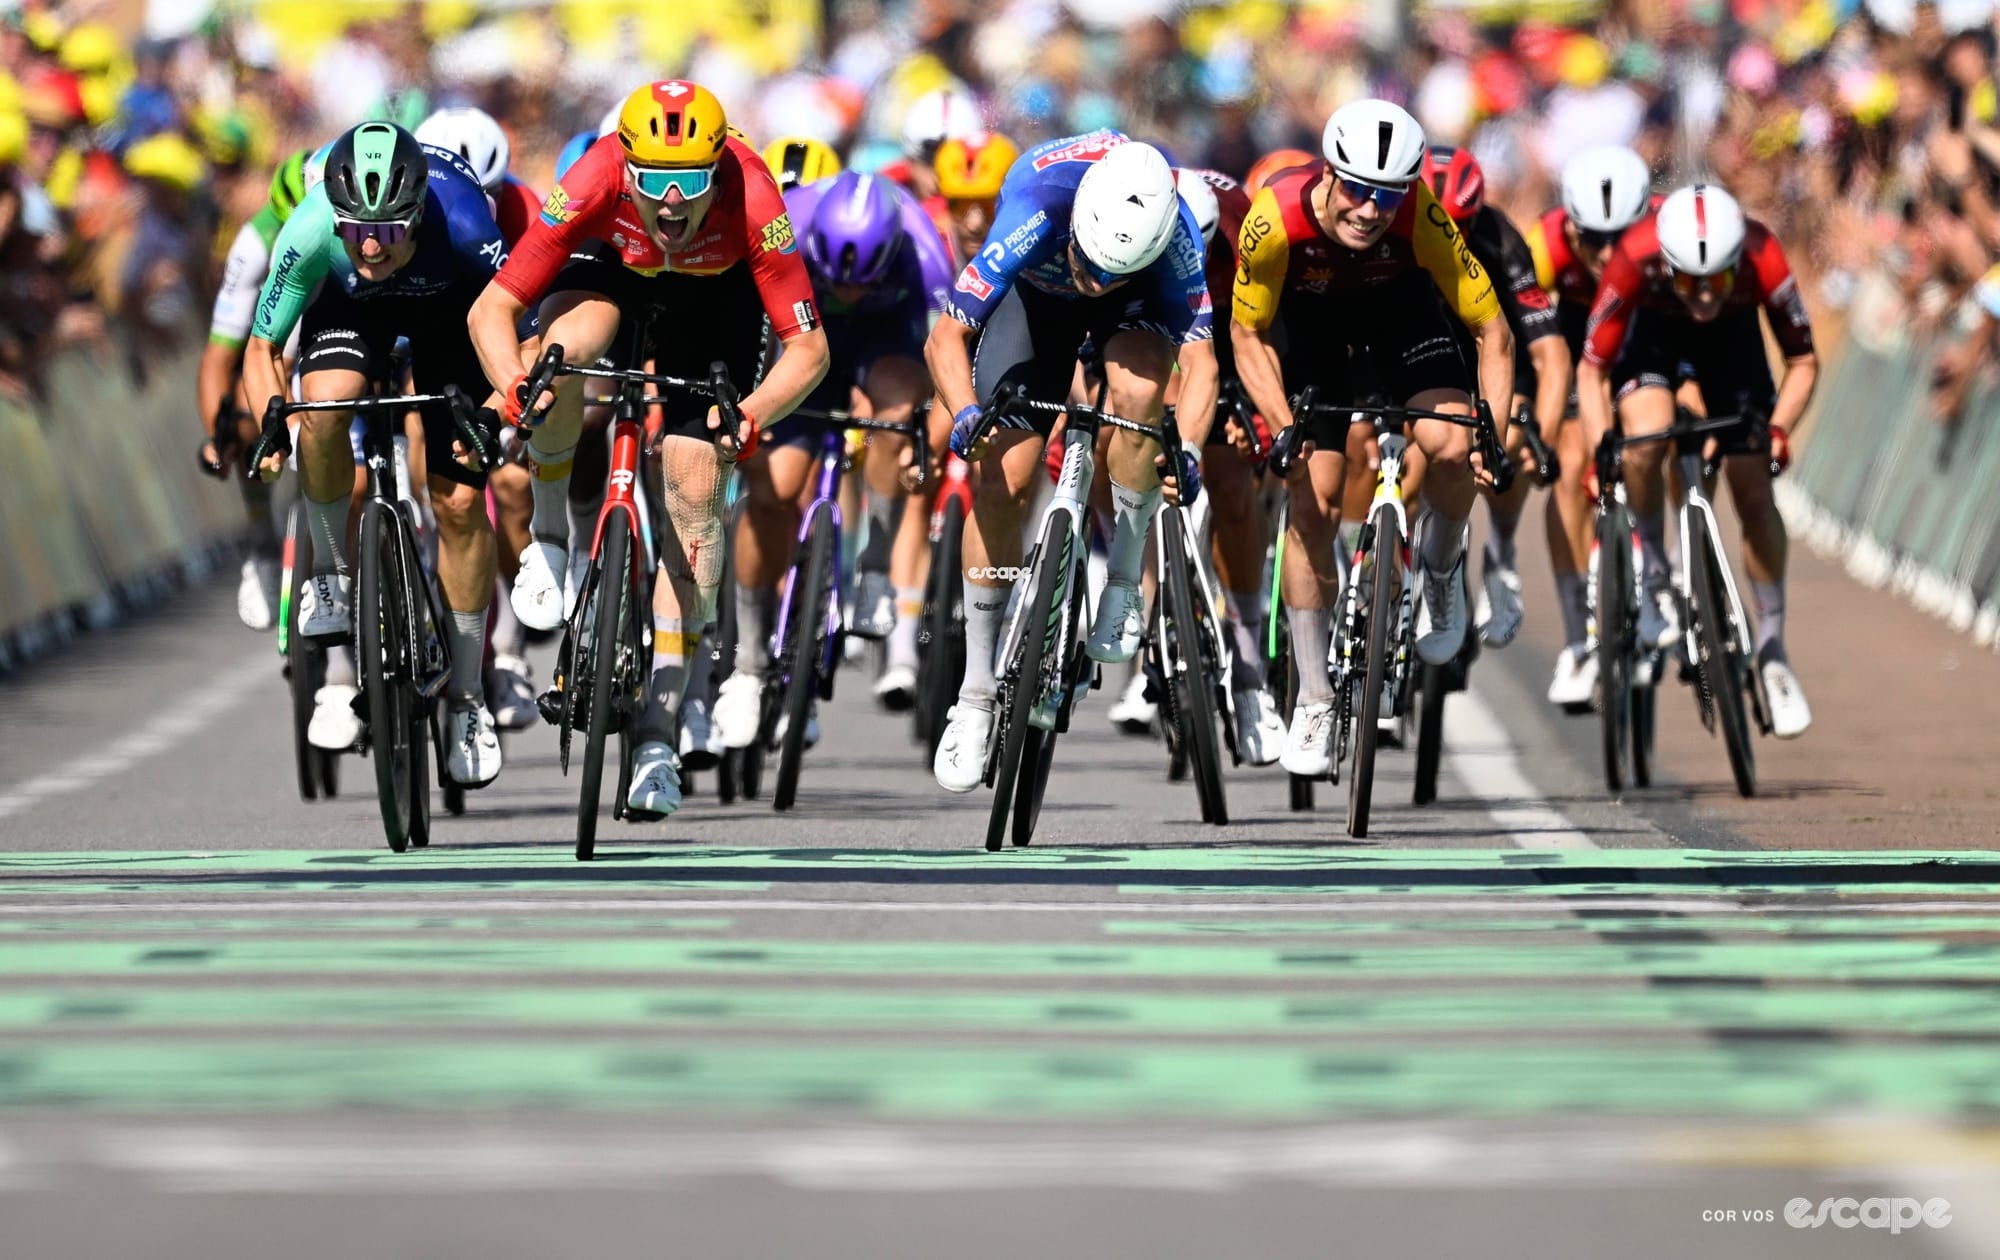
That was, until Wednesday, when Uno-X Mobility's Sören Wærenskold took stage 11 with an average speed of 50.91 km/h, an increase of .6 km/h over the previous record.
 Cosmo Catalano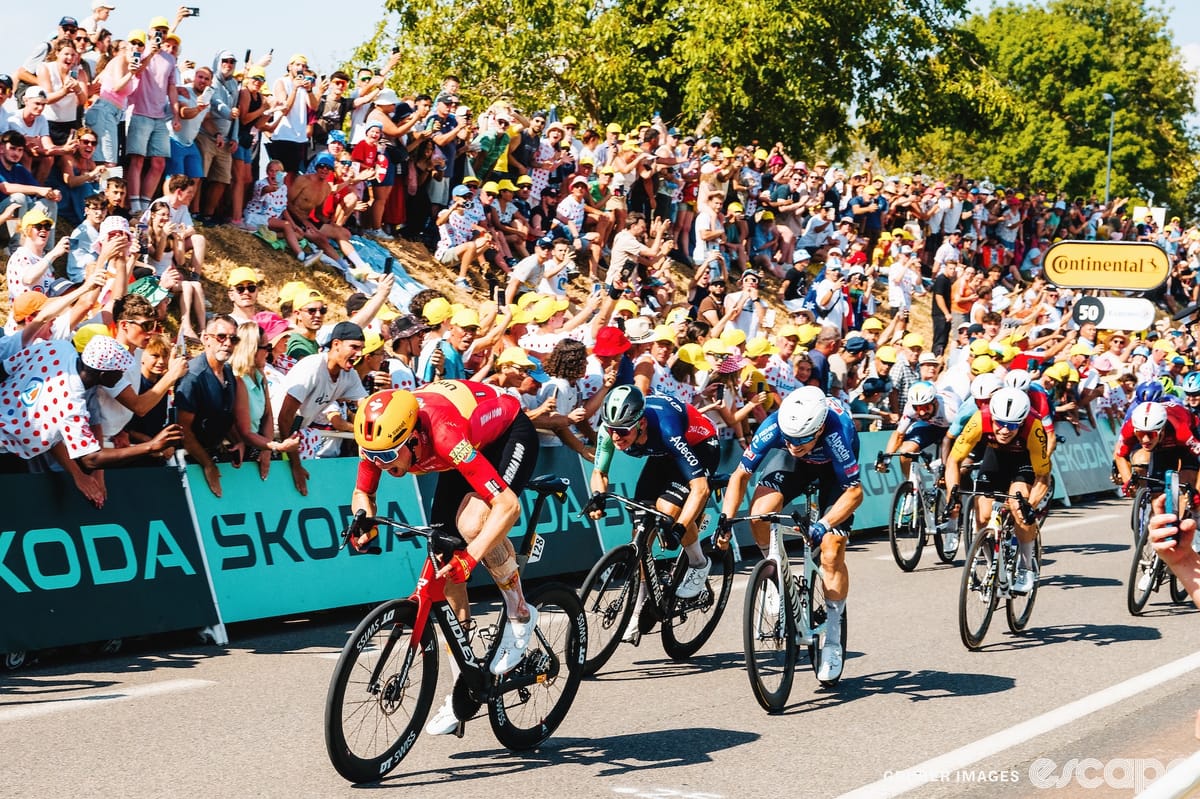
On the one hand, that’s a huge jump, and given all the technological and physiological advancements in recent years, it’s hardly surprising the 2026 bunch cracked a 1999 record. On the other hand, given all those advancements – aerodynamics, tyre efficiency, training methods and even nutrition, which are all cited as explanation for the increase in speeds in recent years – how did a 27-year-old average speed record at the most important race of the year survive until now? Aerodynamics alone was about as far from the 1999 bunch as baggy jerseys are from the 2026 peloton.
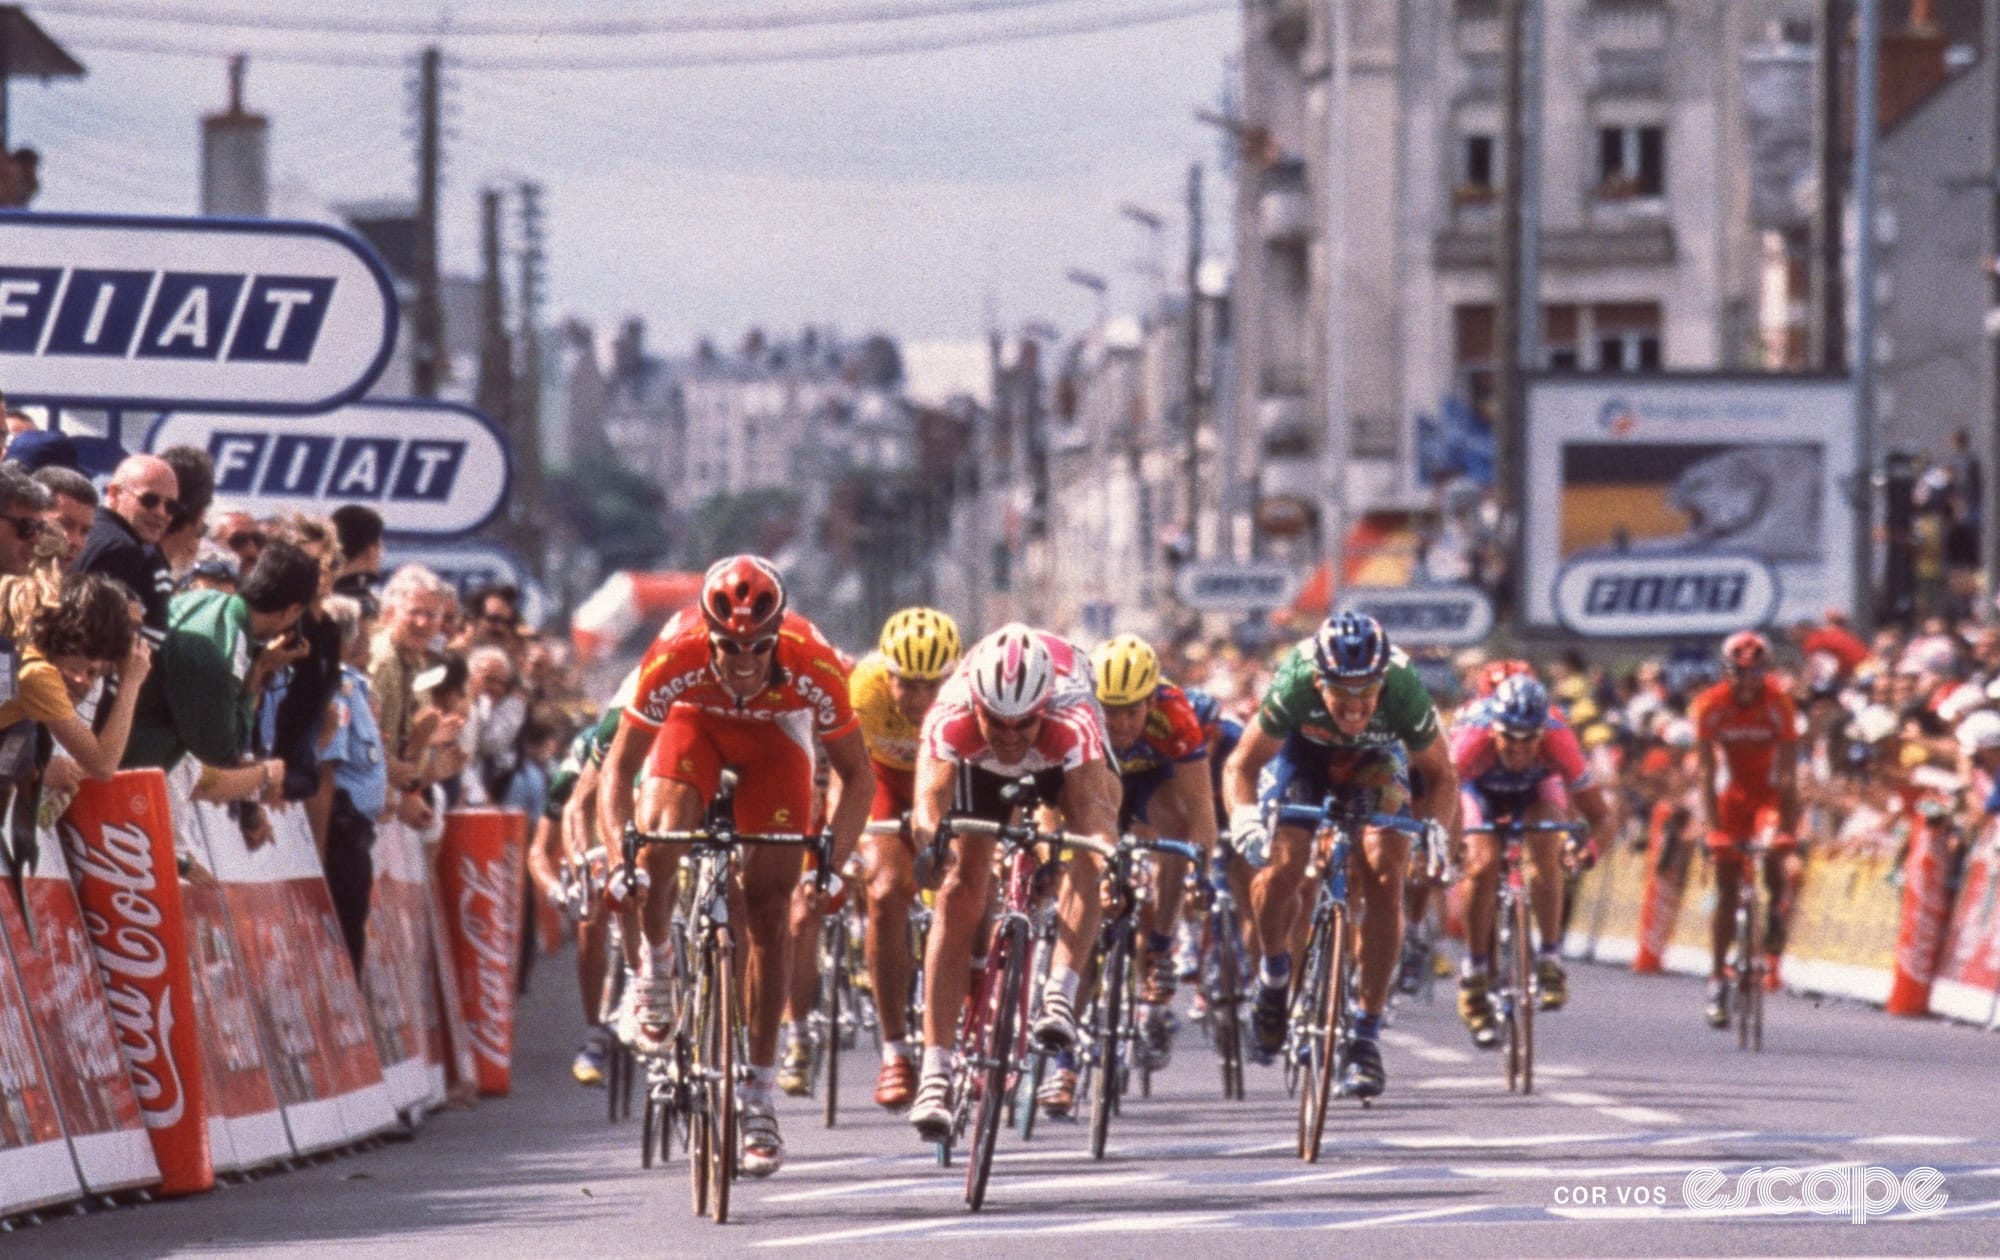
27 years to go half a kilometre per hour
The 1999 record came during the so-called “Tour of Renewal,” as the Tour tried to recover from the Festina doping affair just a year earlier. As we now know, though, it could just as easily have been called the "Tour de Repeat," with EPO abuse remaining widespread.
Does that explain the speeds that day? Not entirely. The larger part of the equation was almost certainly the course and the conditions. The 194.5 km stage from Laval to Blois included just 1,158 metres of elevation gain, as it travelled almost entirely southeast across the Mayenne region of Western France. That’s key, because historical weather records show the wind that day was blowing from the northwest, meaning the riders enjoyed a tailwind for the entire day.
That alone could explain the speeds that day, and a CyclingNews report from the time mentions a strong tailwind throughout the stage. But at first glance, the weather data doesn't appear especially remarkable. Hourly observations show winds of only 7-13 km/h – the sort of values you'd associate with an ordinary summer afternoon rather than the fastest stage in Tour de France history.
That discrepancy between the stage report and weather data could be explained by the single data point measured once per hour that historical records now give us. More importantly, as we all know, even a modest tailwind has a disproportionate effect on speed. A solo rider travelling at 50 km/h in still air experiences a relative air speed of 50 km/h. At the risk of overly simplifying things, add a 10 km/h tailwind and that relative airspeed falls to 40 km/h. It might not sound like much, but because aerodynamic drag increases with the square of airspeed, reducing the relative airflow from 50 km/h to 40 km/h reduces the aerodynamic force acting on the rider by around 36%.
For context, that is probably greater than the total aerodynamic improvement delivered by 27 years of development in rider position, frames, wheels, helmets and clothing. Taken together, those advances may have reduced the drag on a solo rider by around 20%. A 10 km/h tailwind could therefore be worth almost twice as much as the entire aerodynamic evolution from 1999 to today.
The reduction in the total power required from that 1999 rider is smaller because their rolling resistance and drivetrain losses remain unchanged by the weather conditions, but the aero data illustrates why, at risk of stating the obvious, what looks like a slight breeze can have an outsized effect on average speed.
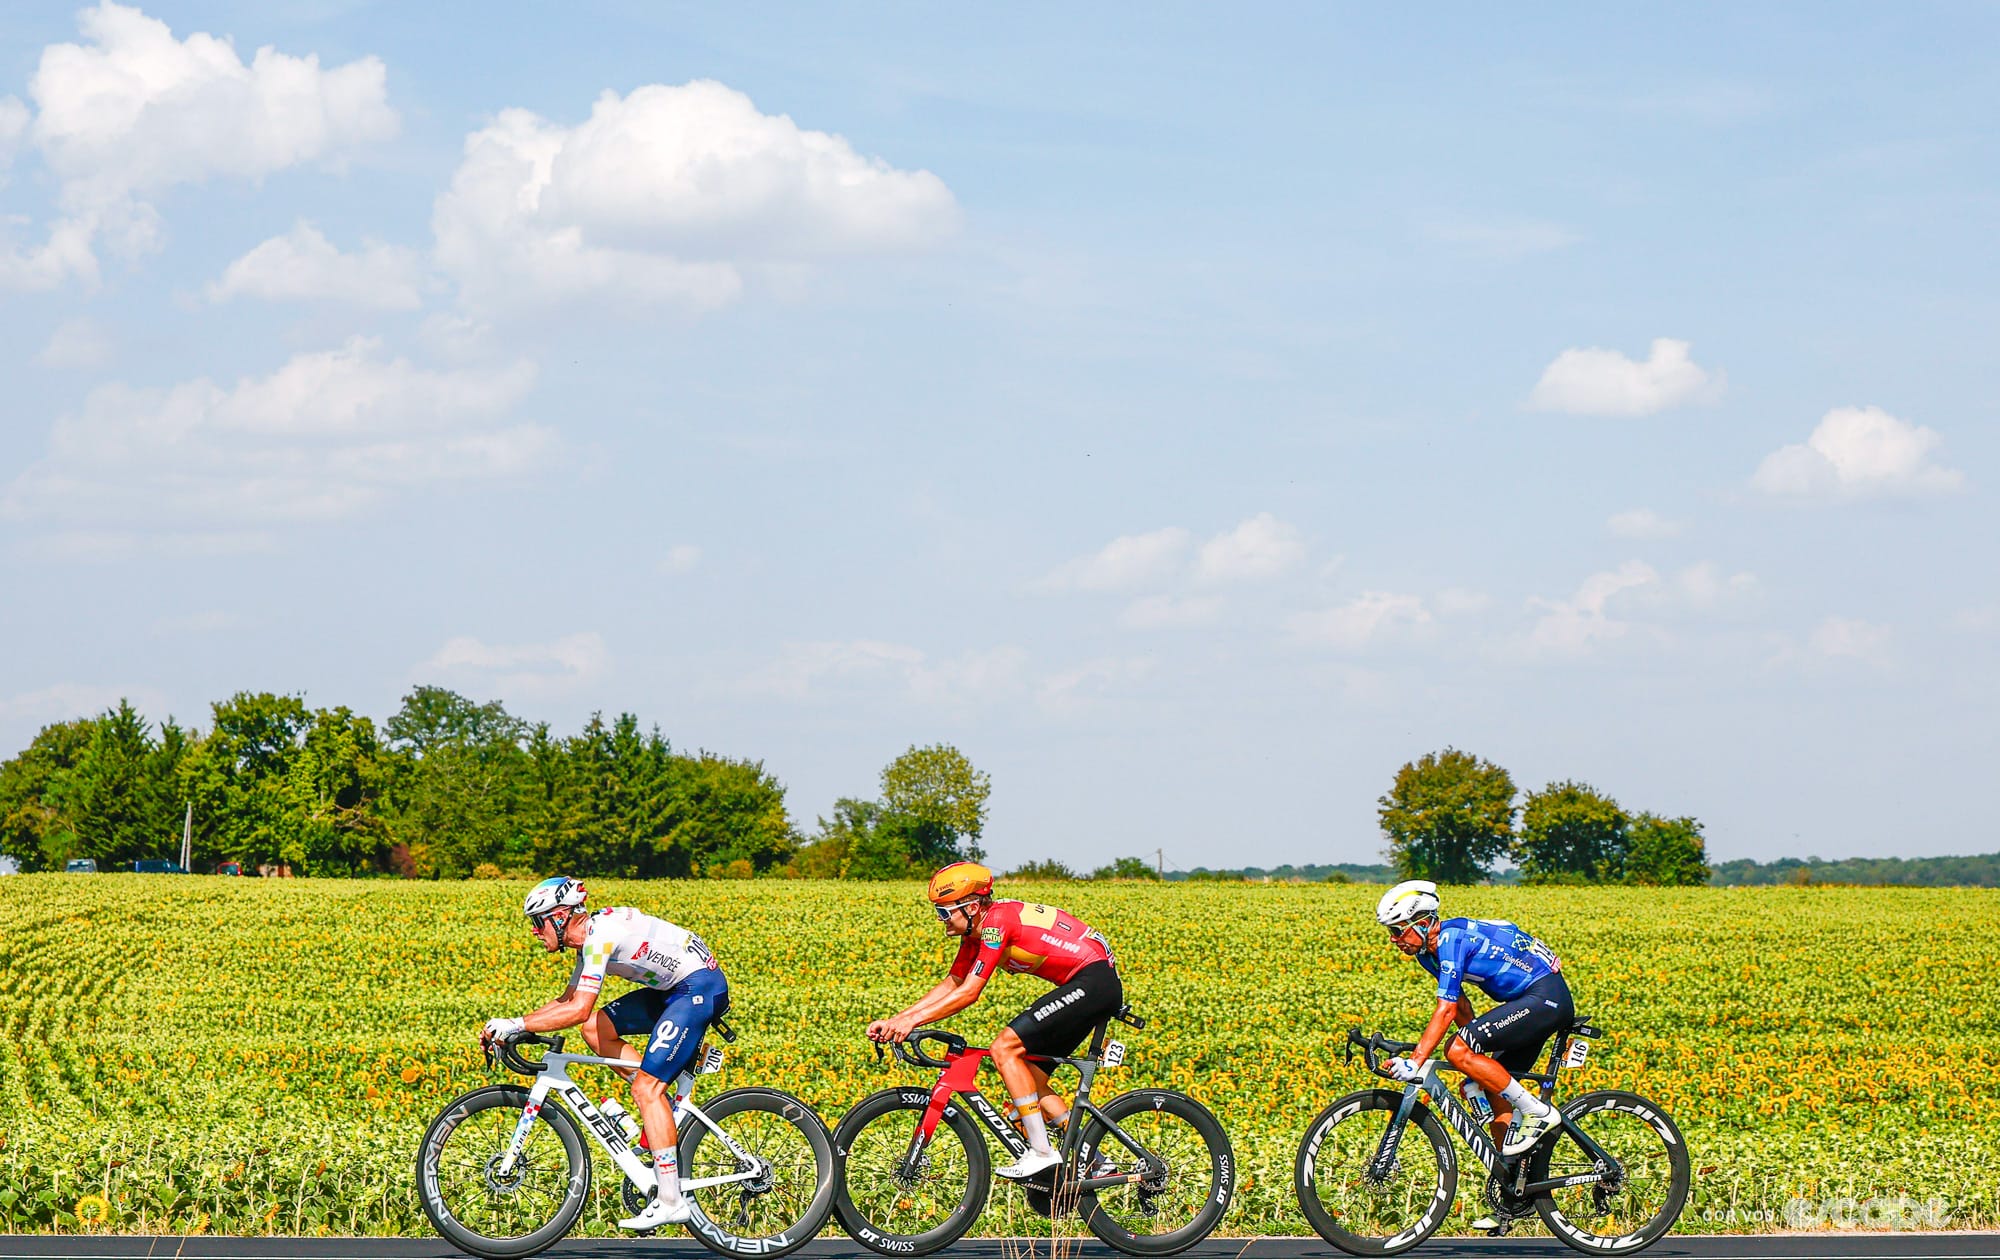
For one thing, today’s peloton didn’t enjoy the same favourable wind conditions as the bunch did in 1999. While this year's stage featured a very similar amount of elevation gain and there were certainly considerable tailwind sections, the peloton did pick up a crosswind and a headwind during parts of the final 40 km, which also included a Category 3 climb. In fact, according to MyWindSock, the peloton faced a headwind for 28% of stage 11.
That’s not the entire picture, though. Comparing Wednesday’s environmental conditions to those of July 7th 1999, temperatures were more than 10°C higher this week, atmospheric pressure was around 25 hPa lower, and the resulting air density was substantially reduced, making the air itself easier to ride through. Add nearly three decades of advances in aerodynamics, tyres, nutrition, and training, and you might have expected the old record to disappear by several kilometres per hour, or at very least find yourself back wondering how it survived so long.
Did we do a good job with this story?