
Grand Tours are called that for a reason. Three weeks is a long time to race your bike; to be so focused on the repetitive daily cycle of racing and recovery. And of course, a successful Grand Tour is built on more than just three weeks – actually preparing for the race takes many months of work, especially if you’re vying for the upper reaches of the general classification.
A new research paper out of Italy shows exactly how much work is involved in such a build-up, following the “day-by-day training and racing characteristics” of one rider in the five months leading up to a podium finish at the Giro d’Italia. And as we’ll see, there are some interesting insights to be gleaned.
How they went about it
There wasn’t anything particularly complicated about the method behind this study. To start with, University of Genoa researcher Gabriele Gallo and his colleagues collected one rider’s training and racing data from the 175 days between the start of their season and finishing the Giro d’Italia. Then, the amount of time the rider spent training or racing each day was catalogued, as was their total load for that day’s efforts, based on their average power. Specifically, their day’s total work (in kJ) was defined as: (average power output (W) x duration of the ride (s)) / 1,000.
Each day’s riding was broken down into three intensity zones, to see how hard the rider was going on any given day, and how that intensity changed throughout the 152 days leading up to the Giro:
The zones used were:
- Zone 1: Low intensity, defined as 0-85% of the rider’s functional threshold power (FTP), where FTP is the amount of power a rider can sustain for an hour. This value of 85% was used because, in the words of the researchers, “it represents a percentage exercise intensity close to the first lactate and ventilatory threshold in professional road cyclists.”
- Zone 2: Medium intensity, defined as between 85-100% of the rider’s FTP.
- Zone 3: High intensity, efforts of above FTP.
From your own riding you might be more familiar with intensity being broken up into more than three zones – five or seven zones most commonly – but Gallo tells Escape that three makes more sense physiologically.
“In exercise physiology we only have three physiological 'zones' separated by two thresholds: the first and second ventilatory/lactate thresholds which separate Z1 / Z2 and Z2 / Z3 in a three-zones model and that can be approximate to some FTP percentage, like in the article,” he says. “For example there is no physiological threshold to divide Z1 and Z2 in a 5/7 zones model – it is just speculation.”
In order for a day’s riding to be included in the study, power data from at least 80% of the day had to be present. On days where 80-100% of the day’s power data were included, “time spent in each zone was increased proportionally.”

Who’s the rider?
So far we’ve referred to the subject of the study only as “the rider”, which mirrors the way the authors refer to him in their paper. The rider isn’t named at any point, nor is the team he rode for, which season the data is from, or what position he finished in the Giro. But there are a bunch of clues which can help us work out who the rider is.
For starters, the rider was 26 years old at the time of the Giro in question, they weighed 64 kg, they were 173 cm tall, they had a VO2max of 81 ml/min, and their 20-minute record power output was 6.6 W/kg. Some of those data points are more useful than others, but when we combine them with the rider’s racing calendar in those 175 days, a clearer picture emerges.
Here are all the races the rider did, based on what we’re told in the paper:
- A seven-day WorldTour race from day 106 to 112
- A six-day WorldTour race from day 121 to 126
- A four-day 2.HC race from day 135 to 138, and
- The Giro d’Italia from day 153 to 175.
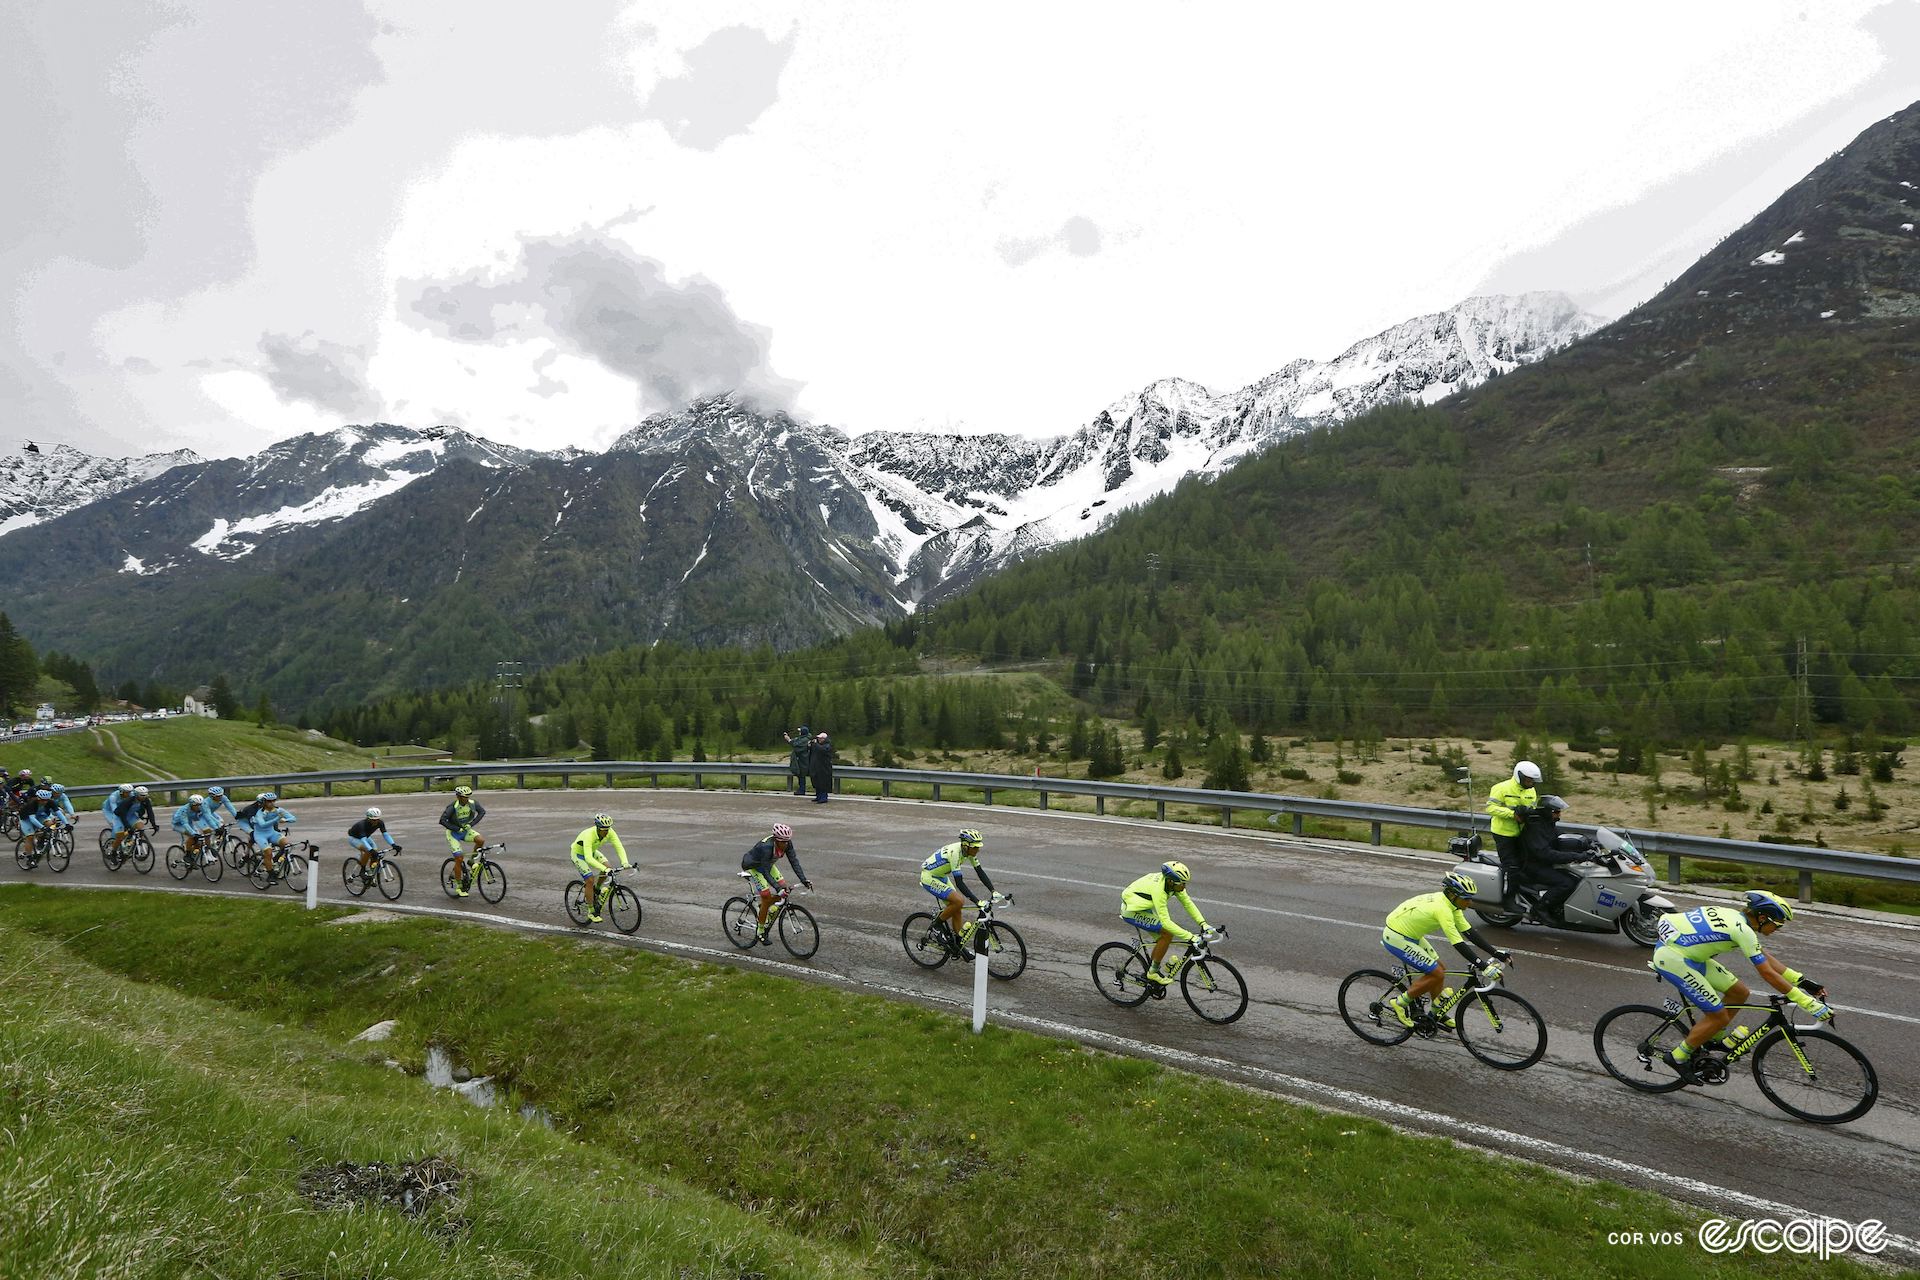
Gallo didn’t want to reveal or confirm who the rider in question is, but by my reckoning, there’s only one rider and season it could be. Want to try and work it out yourself? I’ll give you the answer after this image.

From my observations, the subject of this research is none other than Mikel Landa who rode to third overall at the 2015 Giro d’Italia (behind Alberto Contador and teammate Fabio Aru) in what was a breakout ride for the then-Astana rider. Here are the races mentioned above:
- Days 106-112: Volta a Catalunya – Landa finished 47th
- Days 121-126: Vuelta Ciclista al País Vasco (now known as Itzulia Basque Country) – 22nd
- Days 135-138: Giro del Trentino (now the Tour of the Alps) – second
A few other things to note from Landa’s start to the 2015 season:
- He won stage 5 of the País Vasco but his data from that day isn’t included in the study for some reason.
- He went on to win two stages of the Giro, stages 15 and 16.
Observations from the data
Alright, so what does Landa’s data tell us about his lead-up to and participation in the 2015 Giro d’Italia? Here are a series of observations:
- As you might expect, Landa’s day-to-day load builds in volume and intensity from day 1 of the dataset – December 8, 2014 – until the start of the Giro. More specifically, you can see he only does rides of up to four hours for the first 60 days of the study, with rather minimal focus on medium-intensity efforts and almost no high-intensity efforts at all. Classic base miles. After day 60, we start to see some medium-intensity work, and rides of up to five hours in the lead up to Catalunya. We only see the first real hints of high-intensity training (>FTP) a full 70 days into his season – in mid February.
- As you might also expect, the Volta a Catalunya – Landa’s first race of the year – brought with it his most intense days of the year to that point. From the data we have, the most work Landa did at Catalunya was 4,400 kJ on stage 4, but with three days of data missing from that race, it’s certainly possible stage 4 wasn’t his biggest day. His biggest load at País Vasco, by contrast, was around 3,800 kJ (with two days of data missing), and he reached 4,000 kJ at Giro del Trentino (again with a day of data missing).

- Unsurprisingly, the most work Landa did in a single day over the entire study period was during the Giro itself, on day 173. That was stage 19, where Landa finished seventh to the summit finish in Cervinia. It was a monster day – 236 km, 5,113 metres of climbing, and around six hours and 25 minutes in the saddle for Landa. The Basque rider seems to have done about 5,500 kJ worth of work on that stage. This was the only day in the study (for which we have data) where Landa put in more than 5,000 kJ of work.
- There are two days in the dataset that stand out because of how much time Landa spent riding at high intensity. One is stage 9 of the Giro where Landa finished 13th, 1:01 down on stage winner (and teammate) Paolo Tiralongo, with Landa spending around a full hour of the stage above threshold. The other notable day was stage 16 of the Giro, Landa's second consecutive stage win. On a day featuring five big mountain climbs, this stage also required Landa to spend a total of around an hour above threshold. Ouch.

- As you might expect, Landa never did anywhere near the same amount of high-intensity work in training as he did in racing. There’s a reason many riders feel like they need racing to get themselves up to speed – there’s nothing like the motivation of racing to push yourself to the limit, thereby helping you to improve.
- More specifically: only in eight of Landa’s training sessions did he do more than 10 minutes of high-intensity efforts. A further 29 sessions included 1-9 minutes of high-intensity efforts. His most intense training day – about a week before Catalunya – included around 30 minutes of high-intensity efforts.

- You can see that Landa was working on his durability with the Giro in mind – a significant amount of medium-intensity and high-intensity training was done on sessions of more than four hours in length. When you’re preparing for a race as hard as the Giro, simulating hard efforts while fatigued is important.
- We can see Landa tempering his training intensity around races, which makes a lot of sense. He backs off the intensity in his training post-Catalunya, and does the same after País Vasco.
- Landa’s pre-Giro taper is quite noticeable. After a couple of big rides in the week or so before the Giro began – including a five-and-a-half-hour effort six days before the race – Landa backed things off quite a bit. A 2.5-hour easy ride, five days before the Giro, was the hardest he went from then on.

- If Landa is anything to go by, pro cyclists don’t spend many days off the bike. In the 175 days of the study, Landa only had 27 days without any time in the saddle at all, most of them well before his first race. In fact, 20 of his 27 days off came in the first 57 days of the study, as he built up towards his first race of the year in March.
- And so, in the last 118 days of the study, Landa only had seven days off. His most solid block without any time off was a big month of training – possibly with some of it at altitude? – from days 58 through 89 (early February to early March).

- Landa’s longest day on the bike for the entire study period was on stage 7 of the Giro, a huge day of 264 km which took him nearly seven and a half hours to complete. His longest training ride, by contrast, was around 5 hours 40 minutes, nine days before the Giro began.
- Landa’s data highlights the importance of alternating hard and easy days. In the words of the researchers, “when training load and intensity were increased (from day 60 onward) there was a concomitant increase in the number of training sessions with duration of <2 hours and little or no medium or high intensity performed.”
Concerns and conclusions
As with any study, there are a few questions that should be asked when considering this project’s findings. For one, and as mentioned already, there are quite a few days in the dataset – 10 to be precise – where Landa’s power data wasn’t available. And with nine of those days being race days, it’s hard to say we have the complete picture of Landa’s pre-Giro preparation. It doesn’t matter terribly much from a big picture perspective, but it would certainly be interesting to dive into the details of his stage win at País Vasco, for example, which isn’t available here (and as far as I can tell, Landa isn’t on Strava).
When asked why power data wasn’t available for every day of the study, Gallo gave a few reasons: "TT with no power meter or power meter didn't work appropriately: calibration, battery …”

The other question that springs to mind is whether the age of the dataset – almost a decade old by this point – makes it less relevant today than it might be. While Gallo wouldn’t confirm the age of the dataset (or the rider involved), he did say “I think that there would not be too many differences in the training principles highlighted in the article”.
That said, one training evolution that could warrant a follow-up with more recent data is the increasing reliance on altitude training. While it’s not clear from the data itself how much time Landa spent at altitude in the lead-up to the 2015 Giro, he’s likely spending more in his present build-up to the 2024 Tour de France, say. It would be interesting to see whether that change would lead to different training strategies as well, beyond the location where that training is done.

Gallo also made the point that, regardless of the age of the data, “this case study shows a possible way rather than the 'right' way” of preparing for a Giro podium. That’s an explanation that rings true. Different strategies work for different riders, and no two riders are likely to have the same exact plan in building up for a Grand Tour.
Even for an individual rider, it’s unlikely that there’s any one optimal strategy, and even if there is, there’s nothing to say that optimal preparation translates to a good result. Landa likely followed a similar approach to preparing for other Grand Tours throughout his career but he certainly hasn’t finished third or better in every Grand Tour he’s done (his third overall at the 2022 Giro is his “only” other Grand Tour podium).
By the same token, Tadej Pogačar’s lead-up to the 2024 Giro d’Italia looks very different to that of his GC ‘rivals’ but had any of those riders followed Pogačar’s program to a tee, it’s hard to imagine the result being any different. That is to say: there’s much more to a rider’s Grand Tour performance than the specifics of their preparation.
And yet, it’s fascinating to dive into the details and learn how the best riders approach the longest and hardest races in the world. And in the case of Landa’s successful tilt at the 2015 Giro, it looked something like this: a long, steady build-up with a focus on base miles; a gradual increase in intensity as the season began; and a bunch of hard racing to tune the engine, before finally tapering towards the Giro. Easy, right?
Did we do a good job with this story?