
We hear it all the time: women’s professional road racing is faster than ever, harder than ever, more competitive than ever. We hear that the sport has soared to new heights in recent years; that it’s only getting more difficult to compete at the highest level and much harder to win at the highest level.
But is all of that actually true? And if women’s racing is getting faster and harder, how do we even measure that change?
To answer those questions (and more), we took a deep dive into the data to analyse the more than five hundred days of women’s WorldTour racing since the competition began in 2016. As you'll soon see, the data paints an intriguing picture of the evolution of women’s cycling, even if the conclusions are a little more complicated than we might expect.
Part 1: Average winning speeds
Let’s start at the most obvious point: by comparing the winning average speed of a bunch of different races over time. If women’s racing is getting faster, then we’d probably expect to see those winning speeds trending upwards over time, right?
For this particular discussion, we’ve looked at almost every one-day race that’s currently in the Women’s WorldTour (WWT), noting the average winning speed for as far back into the race’s history as we have access to. The only current WWT one-day races we didn't include were Milan-San Remo and the Copenhagen Sprint, both of which have only been around for a couple years, and therefore offer little by way of comparative value.
Why no stage races? With the exception of a select few events, virtually all stage races feature different courses from year to year, making it near-pointless to compare one edition to another. While one-day races evolve over time too (more on that in a moment), their routes generally remain close enough from year to year to at least allow for a rough comparison.
So what does the data show? Let’s take a look at some examples, starting with the Tour of Flanders. The chart below shows the average speed of the winning rider in each edition of the women’s Ronde since the race began in 2004.
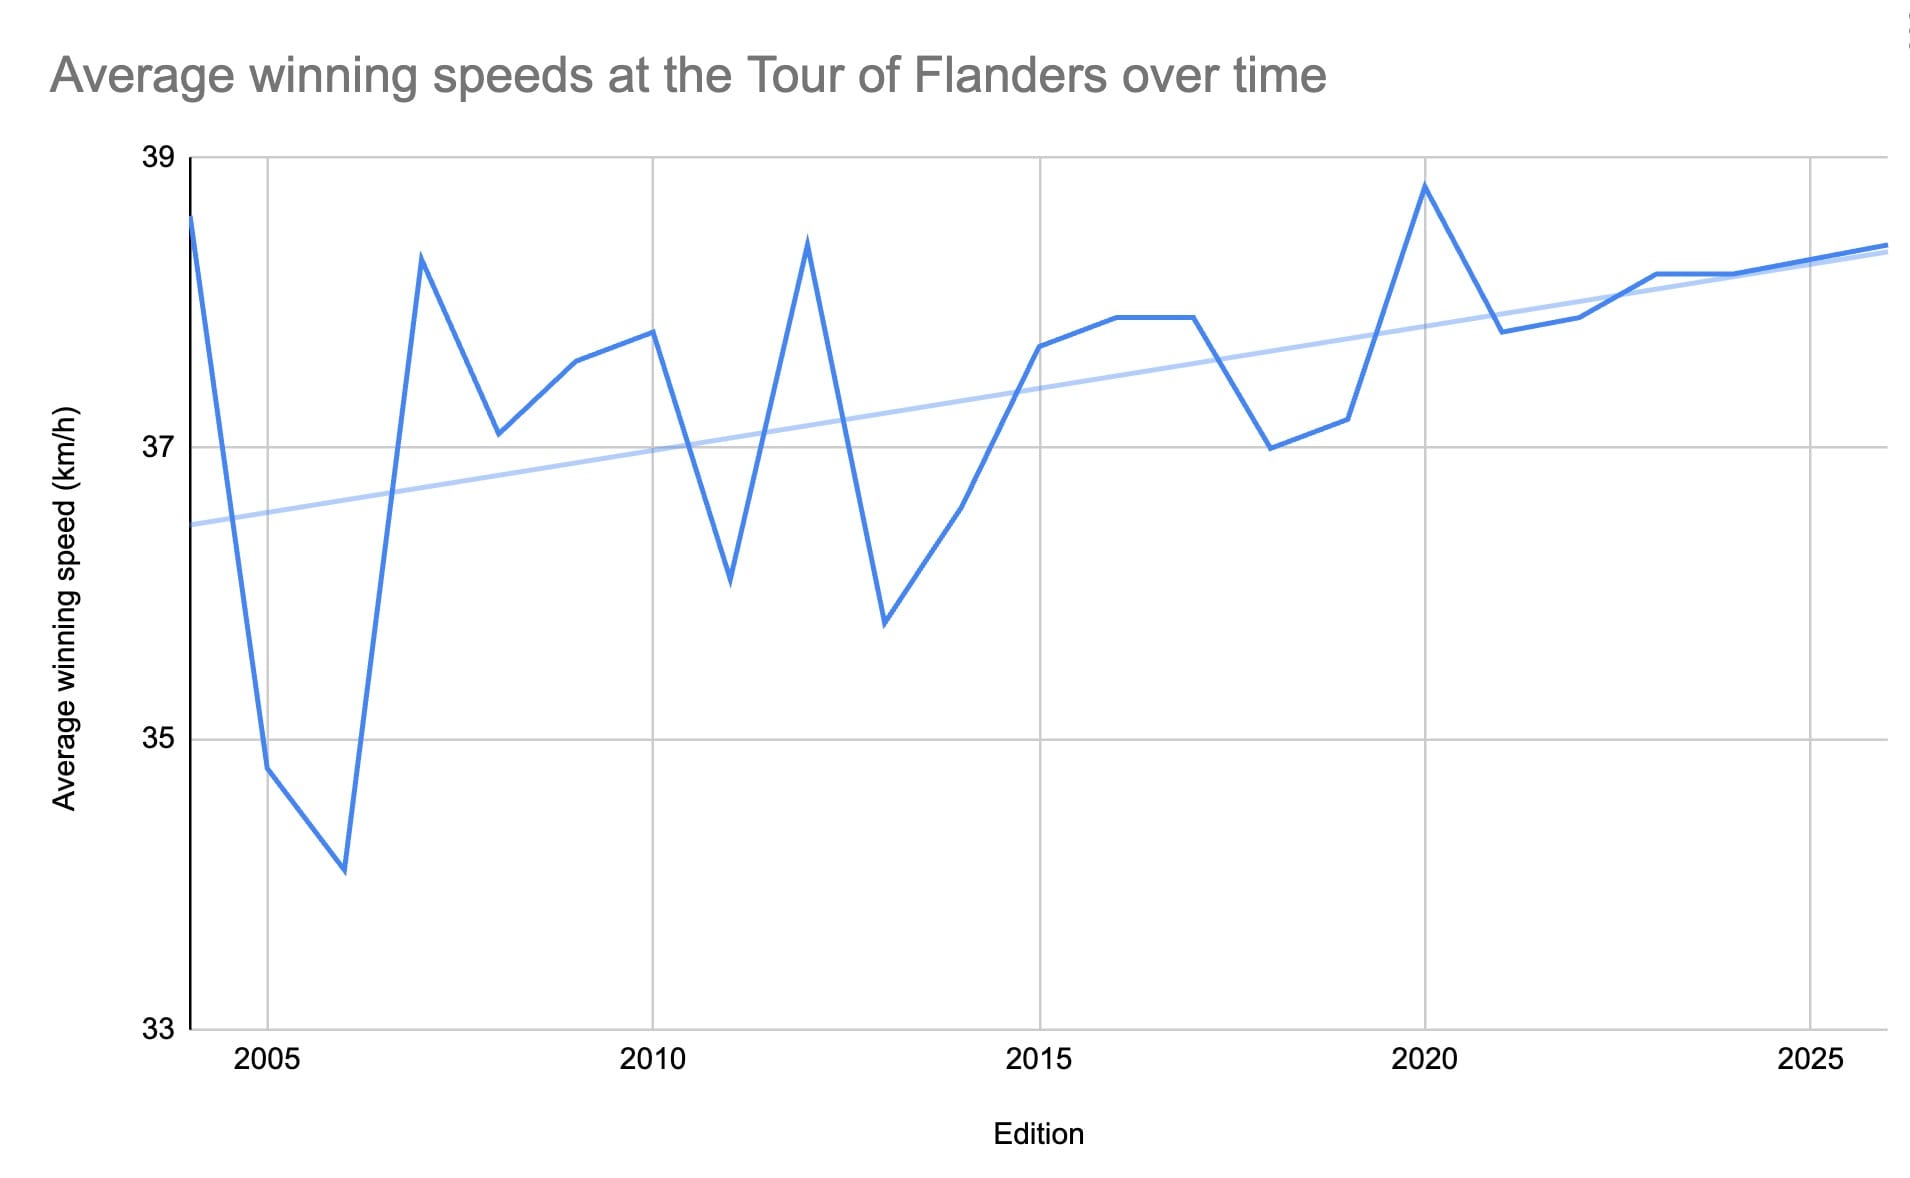
While the 2004 edition was actually won at a higher average speed than this year’s race – and while there’s clearly plenty of variation in winning speed from year to year – the trendline shows that the average winning speed at De Ronde is trending upwards over time.
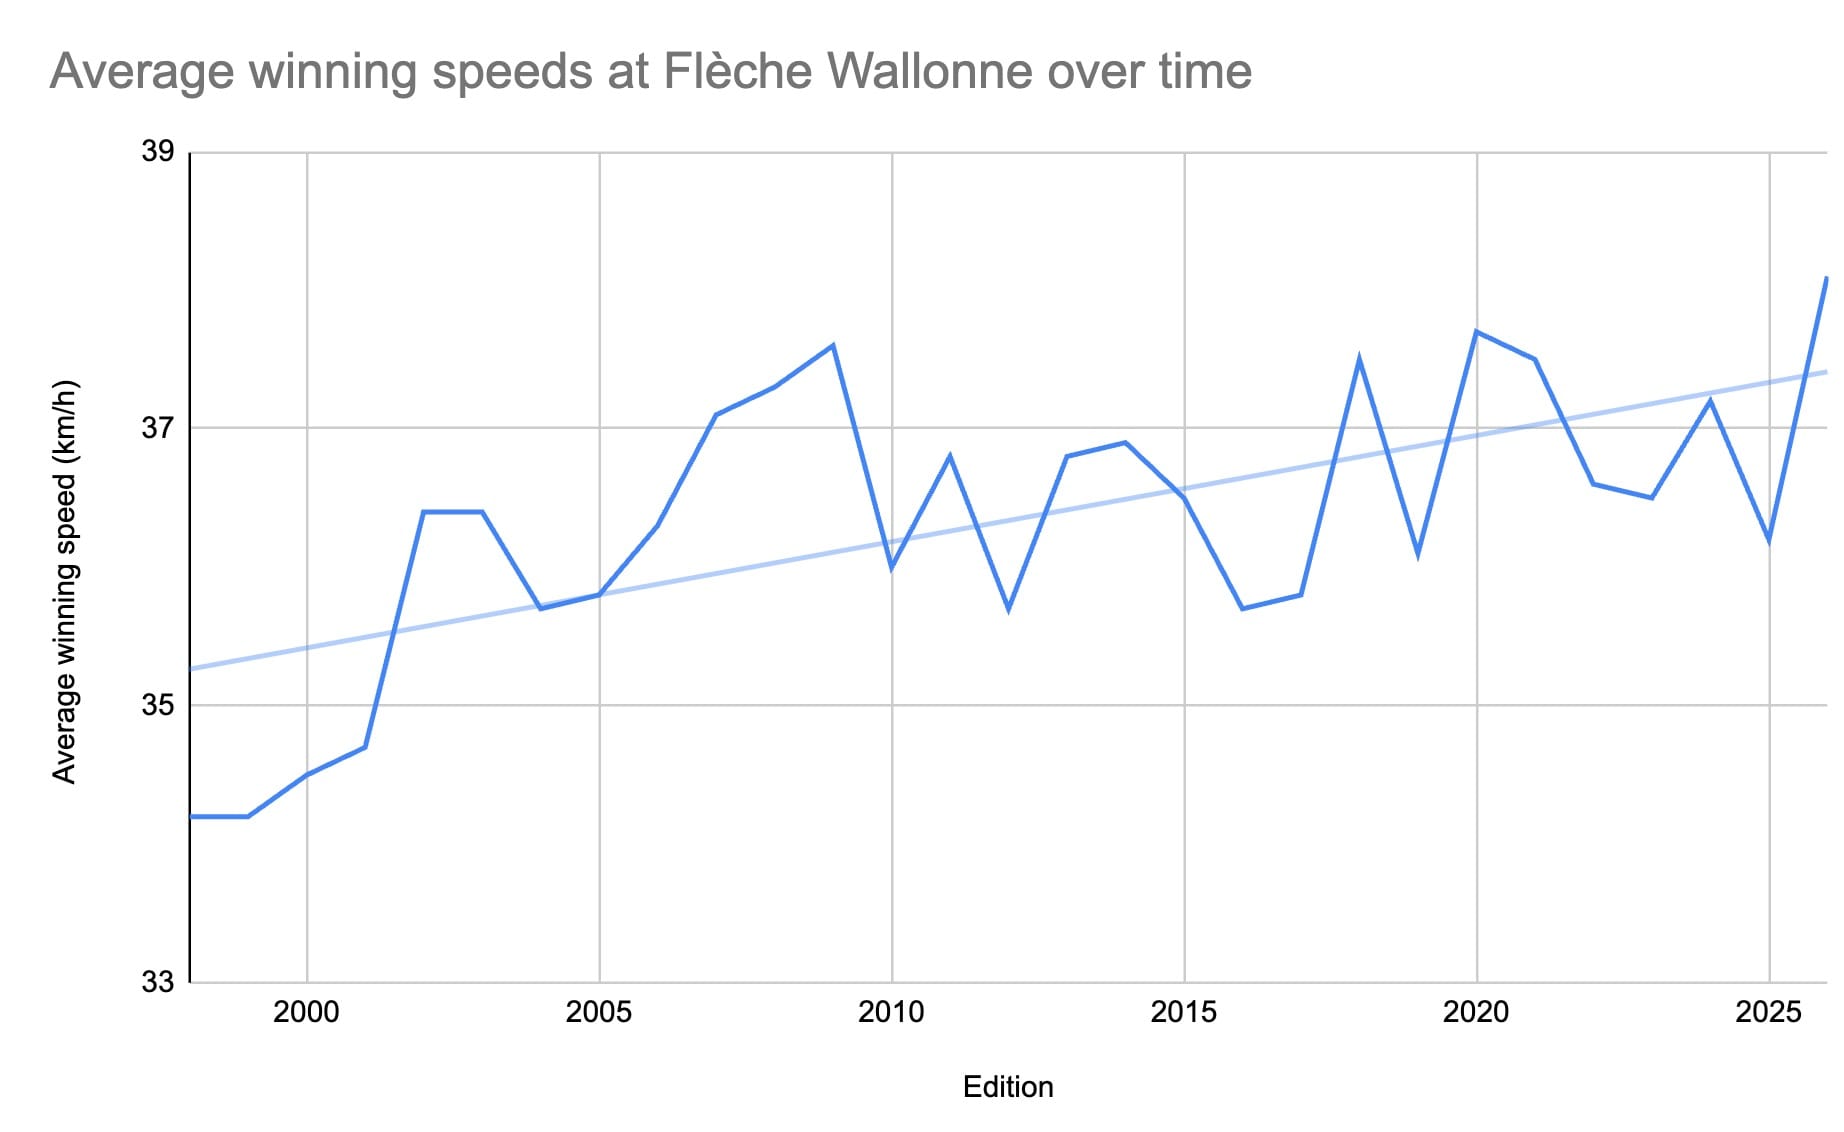
It’s a similar story at Flèche Wallonne where the upward trajectory is reasonably obvious.
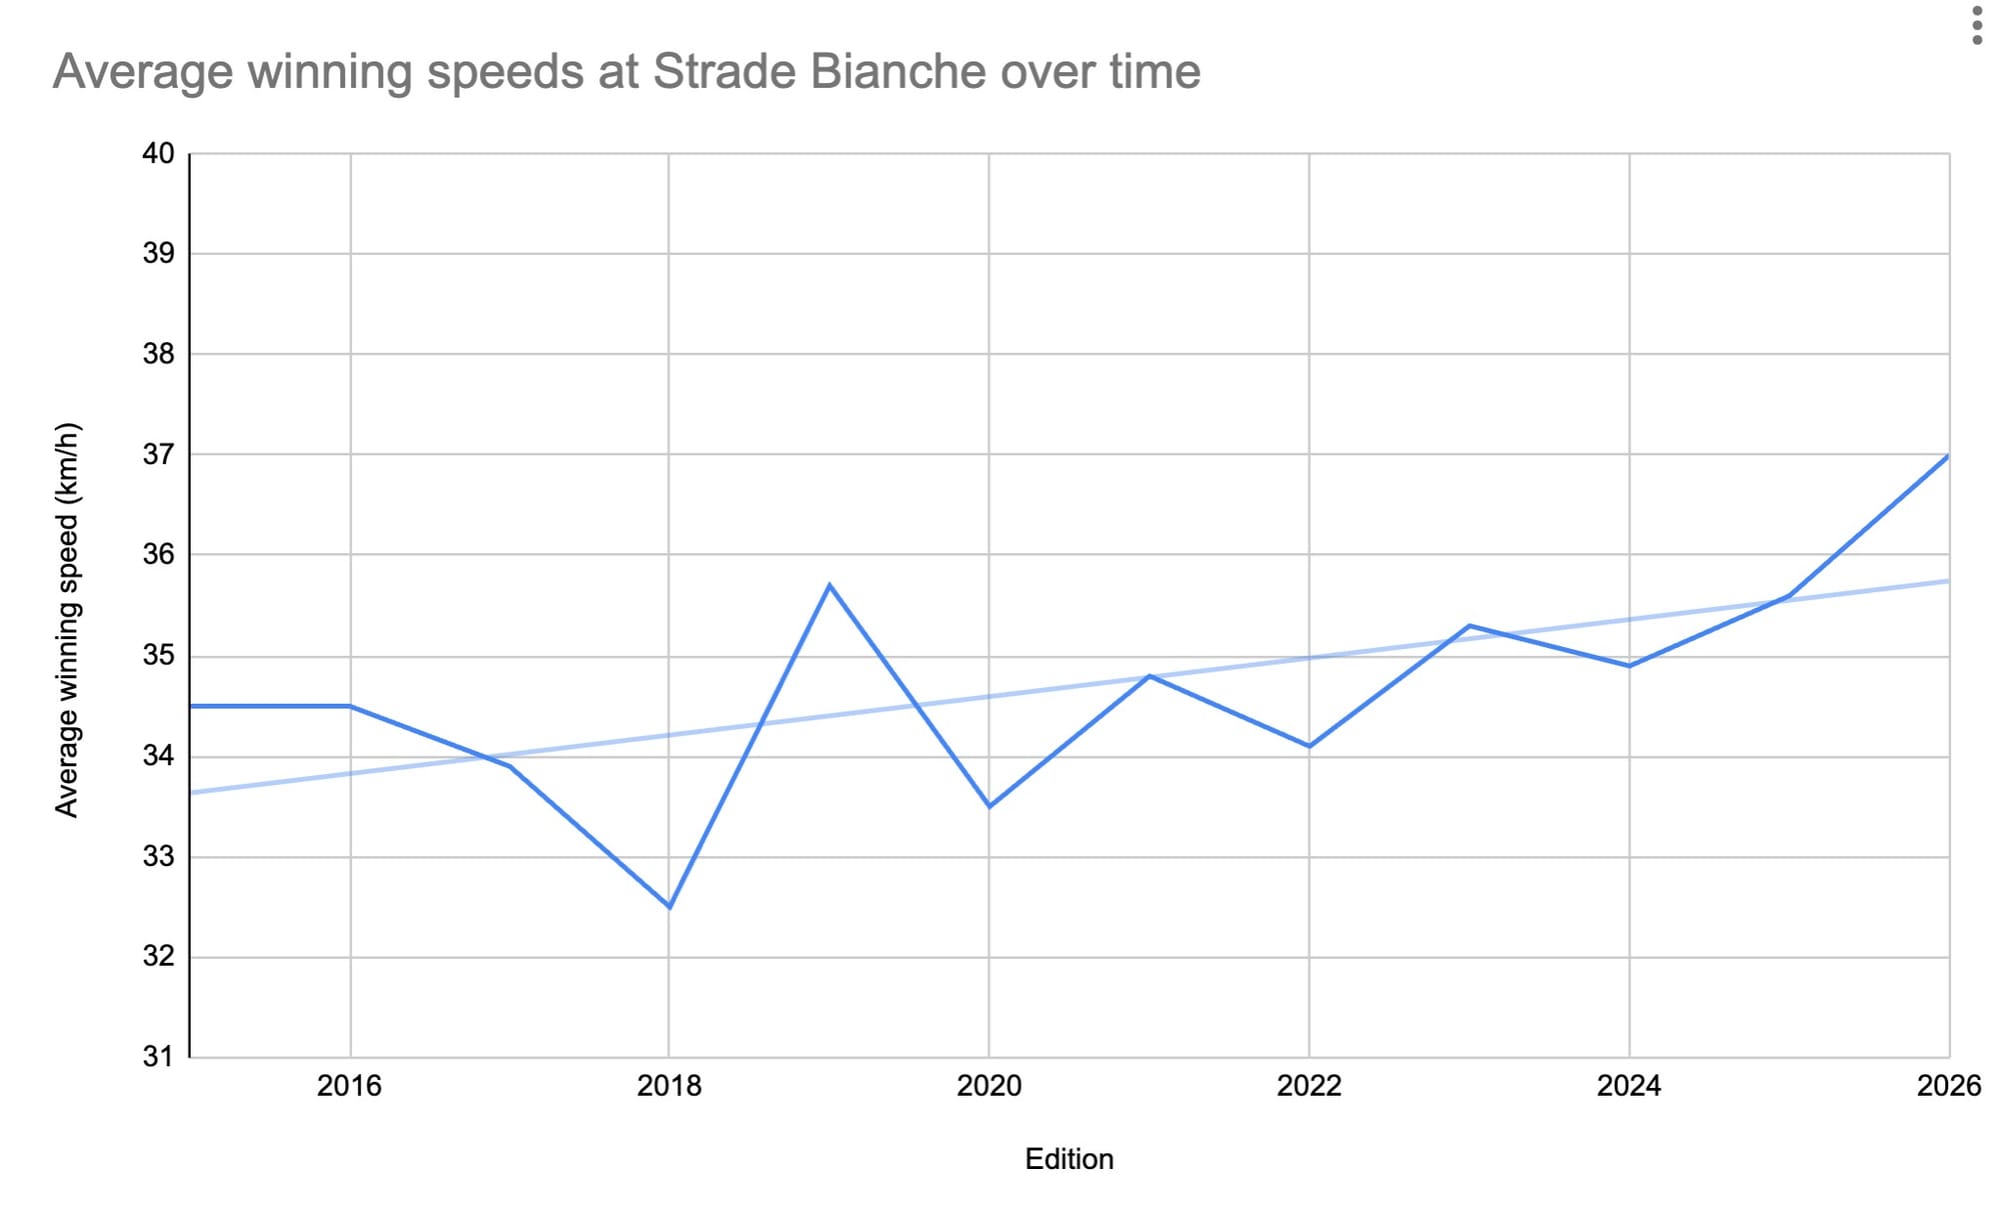
Strade Bianche, too, shows a similar trend, particularly in the last couple years. Note the scale here though. Where Flanders and Flèche have been trending gently upwards since the early 2000s (or earlier), Strade’s upward trend is happening even quicker (since 2015).
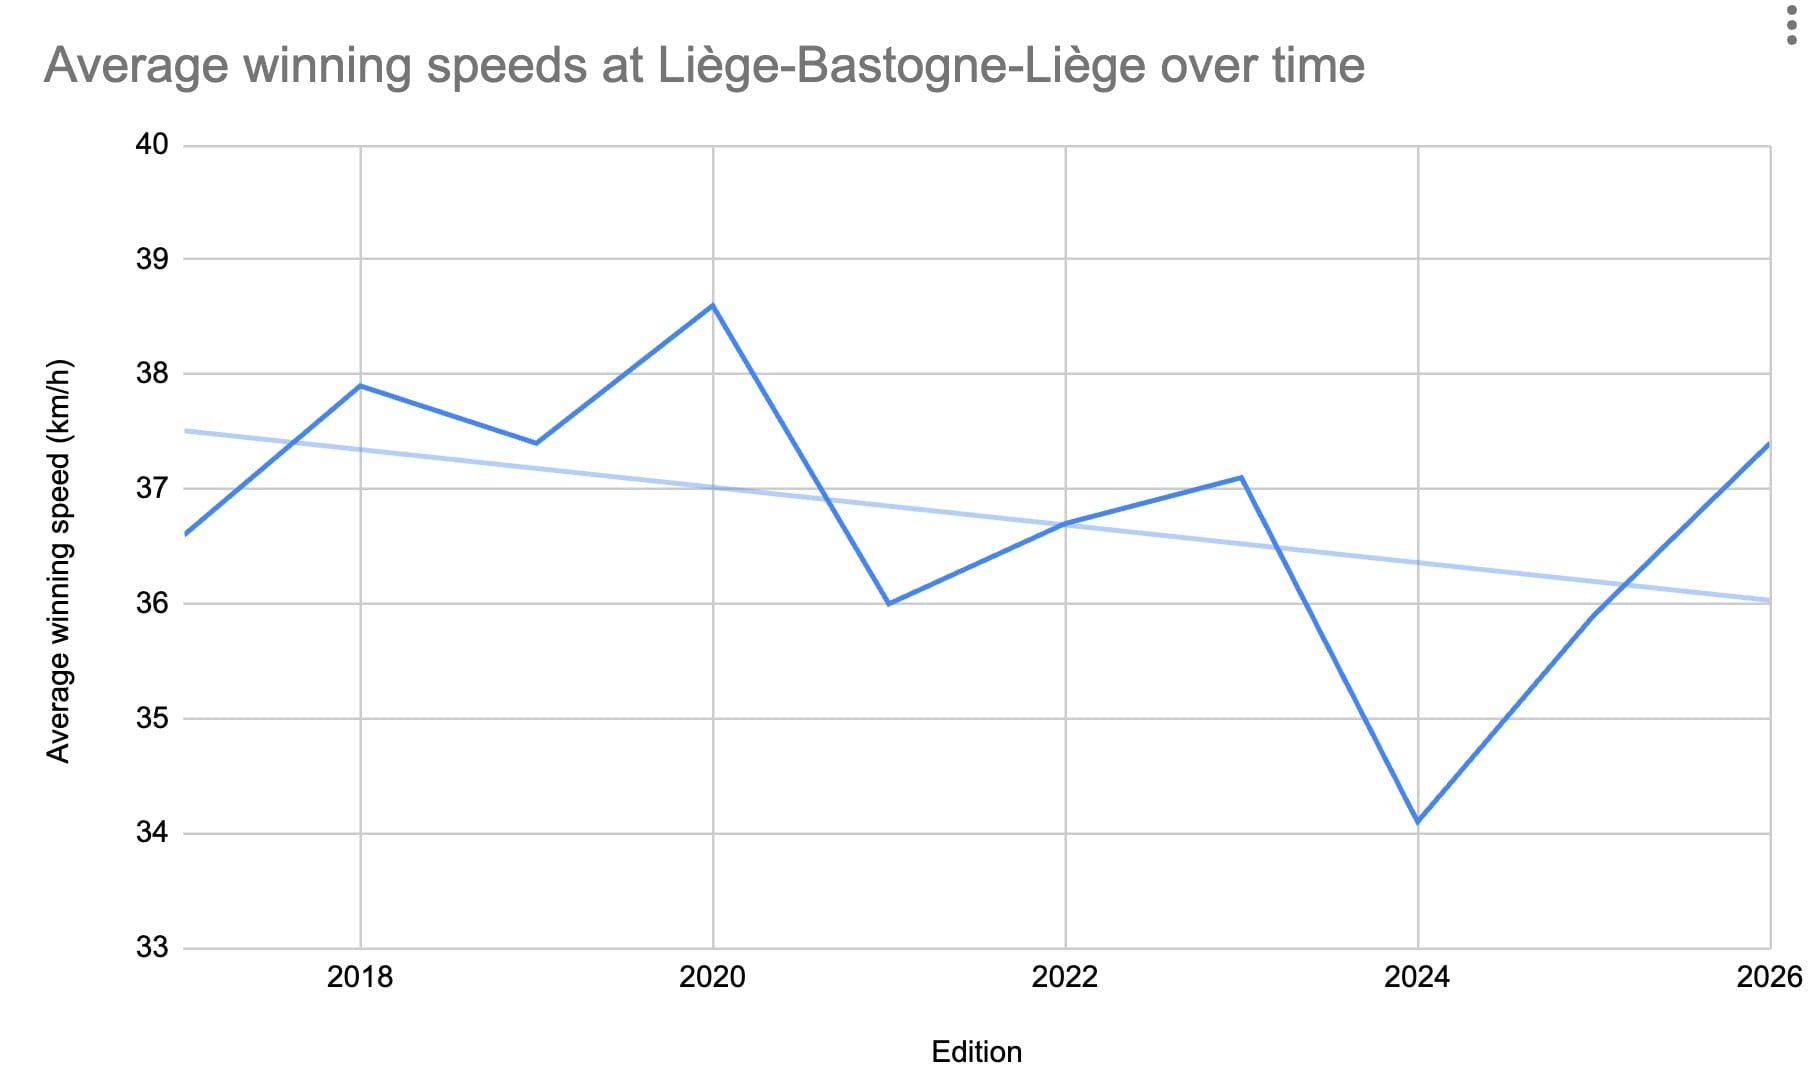
Of the 14 WWT one-day races sampled for this analysis, nine appear to be trending towards faster average speeds. Of the remaining five, one seems to be standing still (Trofeo Alfredo Binda) while four actually seem to be trending slower. Perhaps the most striking of these is Liège-Bastogne-Liège which has been getting faster over the past three years, but has been trending slower overall since it began in 2017.
Still, the majority of races in the women’s WorldTour seem to be getting faster. So is it true to say that WWT racing is getting faster overall? That would be a bold claim to make based solely on the above.
For starters, the dataset used is far from perfect. Most races on the women’s WorldTour have been getting longer in recent years (consider this foreshadowing) and as was hinted at above, it’s rare for a race to keep the exact same route for any length of time.
Remember, too, that road cycling is a sport where so many variables can affect how fast any single race is ridden – factors like wind speed and direction, whether there was any rain, whether crashes influenced peloton dynamics, the tactics of those within the race, and so much more. When you’re comparing races over time, any or all of these variables can be different, making it harder to compare like for like, especially when route changes are involved.
So what if we step back and take a broader view? Would it be more instructive to look at things from a season-long perspective?
Did we do a good job with this story?