
Cycling’s one-day races might not require the endurance of a Grand Tour. In terms of intensity, complexity, and physical demand, they often rival or exceed them, packing all the drama into a single day in the saddle. There is no time to ease in, no chance to recover: just six hours of effort, executed under pressure, often in brutal conditions.
As I worked through power data from the spring classics, one question kept resurfacing: Which one-day race is objectively the hardest?
Each has its challenges. Paris-Roubaix punishes riders with cobbles. The repeated climbs of Liège-Bastogne-Liège are relentless. The Road World Championships can throw in major elevation gain, distance, and extreme weather. But which race, when you strip away the pageantry and look at the raw data, asks the most of a rider?
To answer this question, I analysed rider power files from five iconic one-day races and compared them across key performance metrics. I also spoke with current pros to add real-world context to the numbers.
Here is what the data revealed – and where the hardest day in cycling might lie.
The contenders: A brief overview
On my quest to reveal which one-day race is the hardest, I have settled on four Monuments and the World Championships road race. Except for Milan-San Remo, the remaining Monuments can all claim to be the toughest one-day race the peloton faces, not only because of the terrain and length but also because of how hotly contested they are. Riders base their whole seasons around each of these races. Compared to other races throughout the season, the overall level is higher at these races.
Tour of Flanders
Key Stats
Distance: 268.9 km
Elevation gain: 2,200 metres
Elevation gain per 100 km: 818 m
Fastest edition: 2025 (44.99 km/h)
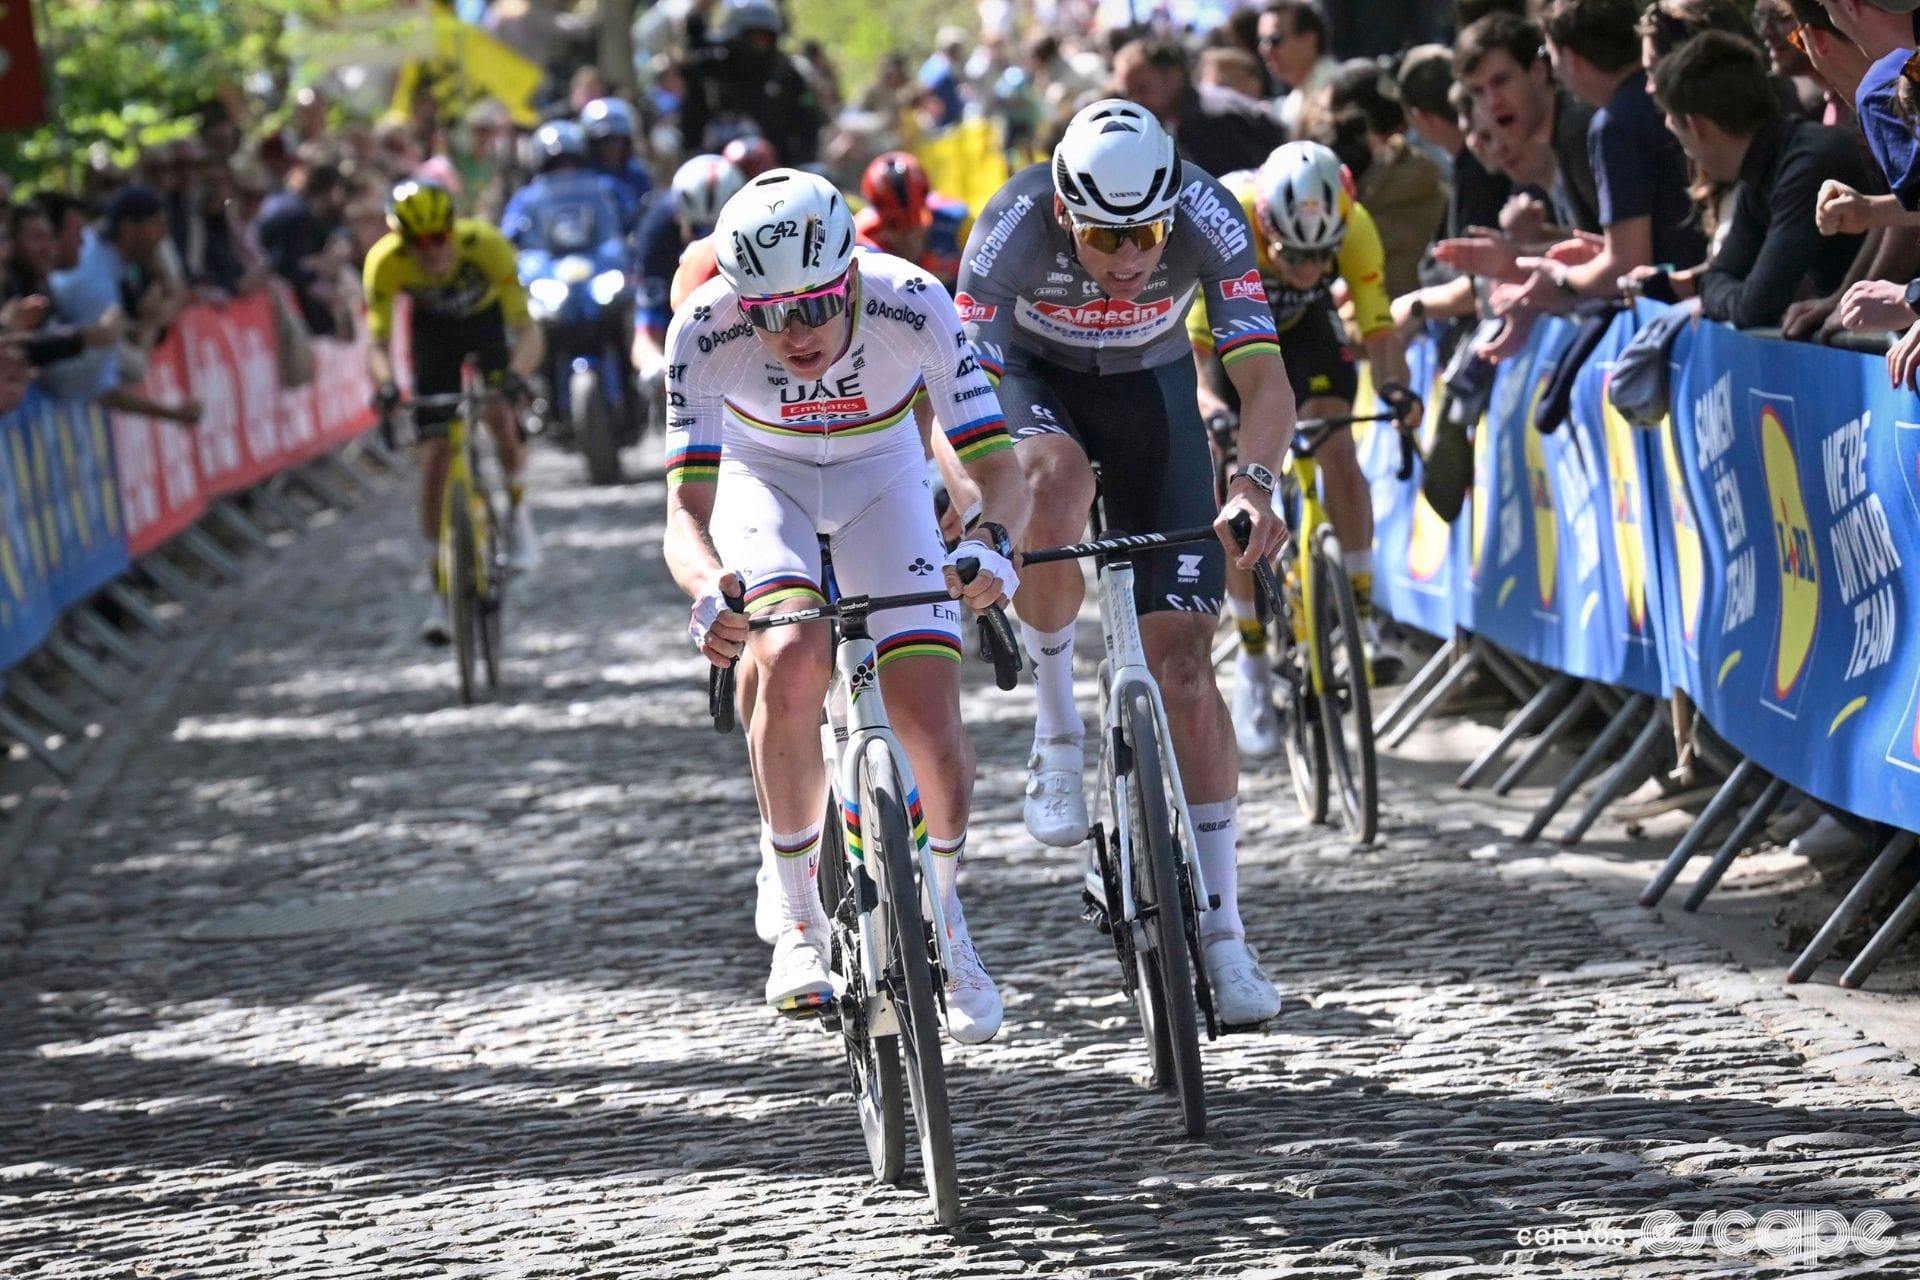
The Ronde Van Vlaanderen has everything you would expect of one of the most gruelling one-day races of the season. At almost 270 km, the race is at least a six-hour shift in the saddle, but the distance only tells a slice of the story. Flanders is a race of two parts: After 120 km of rolling Belgian countryside, the race enters the second phase, where 12 cobbled climbs, joined by an additional seven cobbled sectors, send the intensity of the race through the roof.
It is not just the short, explosive power climbs that make the race attritional. The narrow bergs mean an eight-man-wide peloton gets squeezed down to three or four across heading into each climb. That creates high-speed, high-intensity fights for position for several kilometers before each climb starts (at least until things start to thin out).
Stringing the peloton out time after time means that for anyone outside of the top 20, there is a lot of effort to get back up towards the front, and if a move goes whilst you are fighting to get back on terms, all you can do is watch it sail off into the distance.
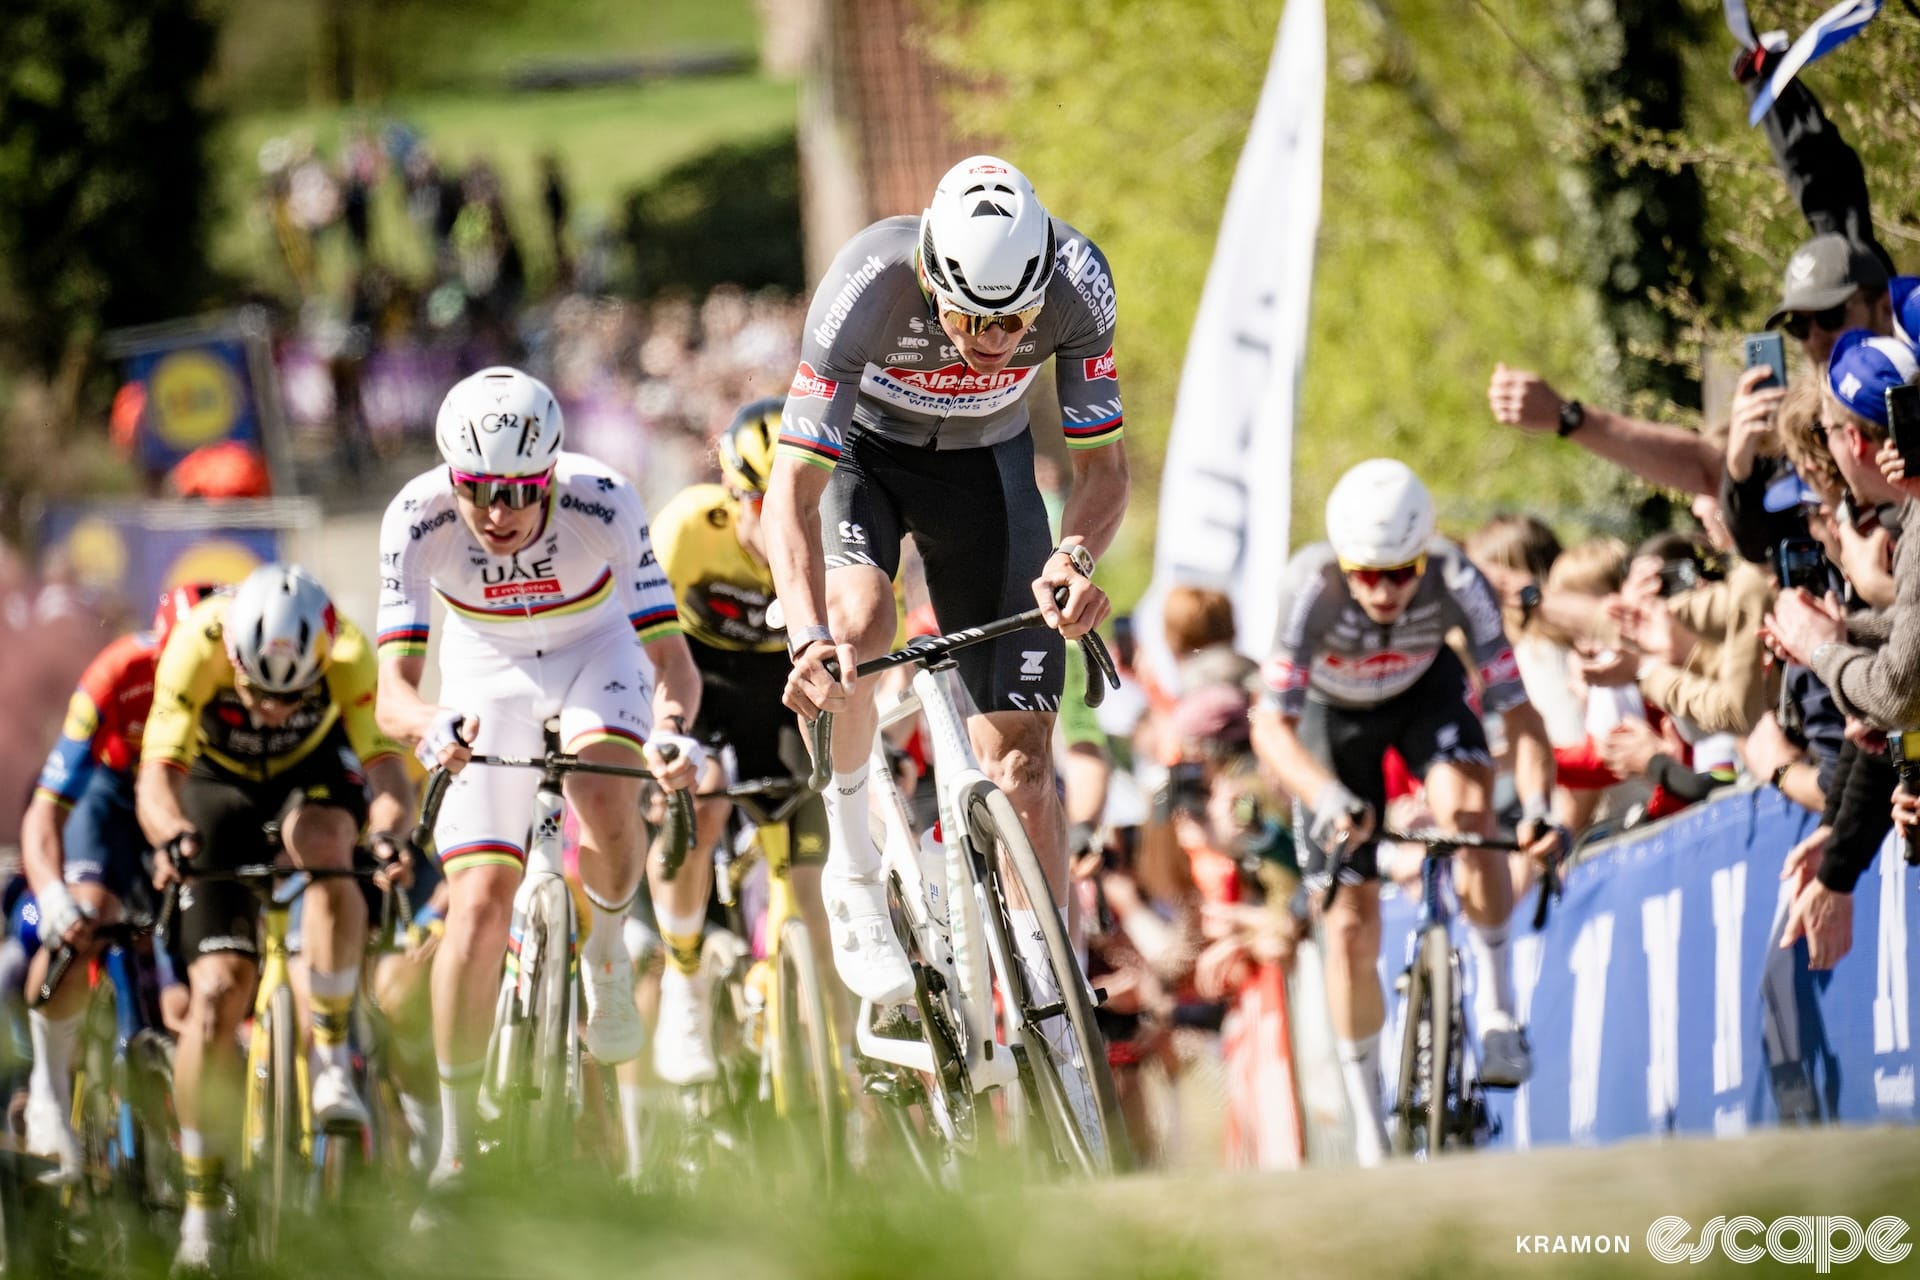
The fact that the largest group to contest the win was four riders in 2022 (although Mathieu van der Poel and Tadej Pogačar were only joined in the final few hundred metres) alludes to the difficulty of the race, where only the most tactically astute, fatigue-resistant riders can claim the top step on the podium.

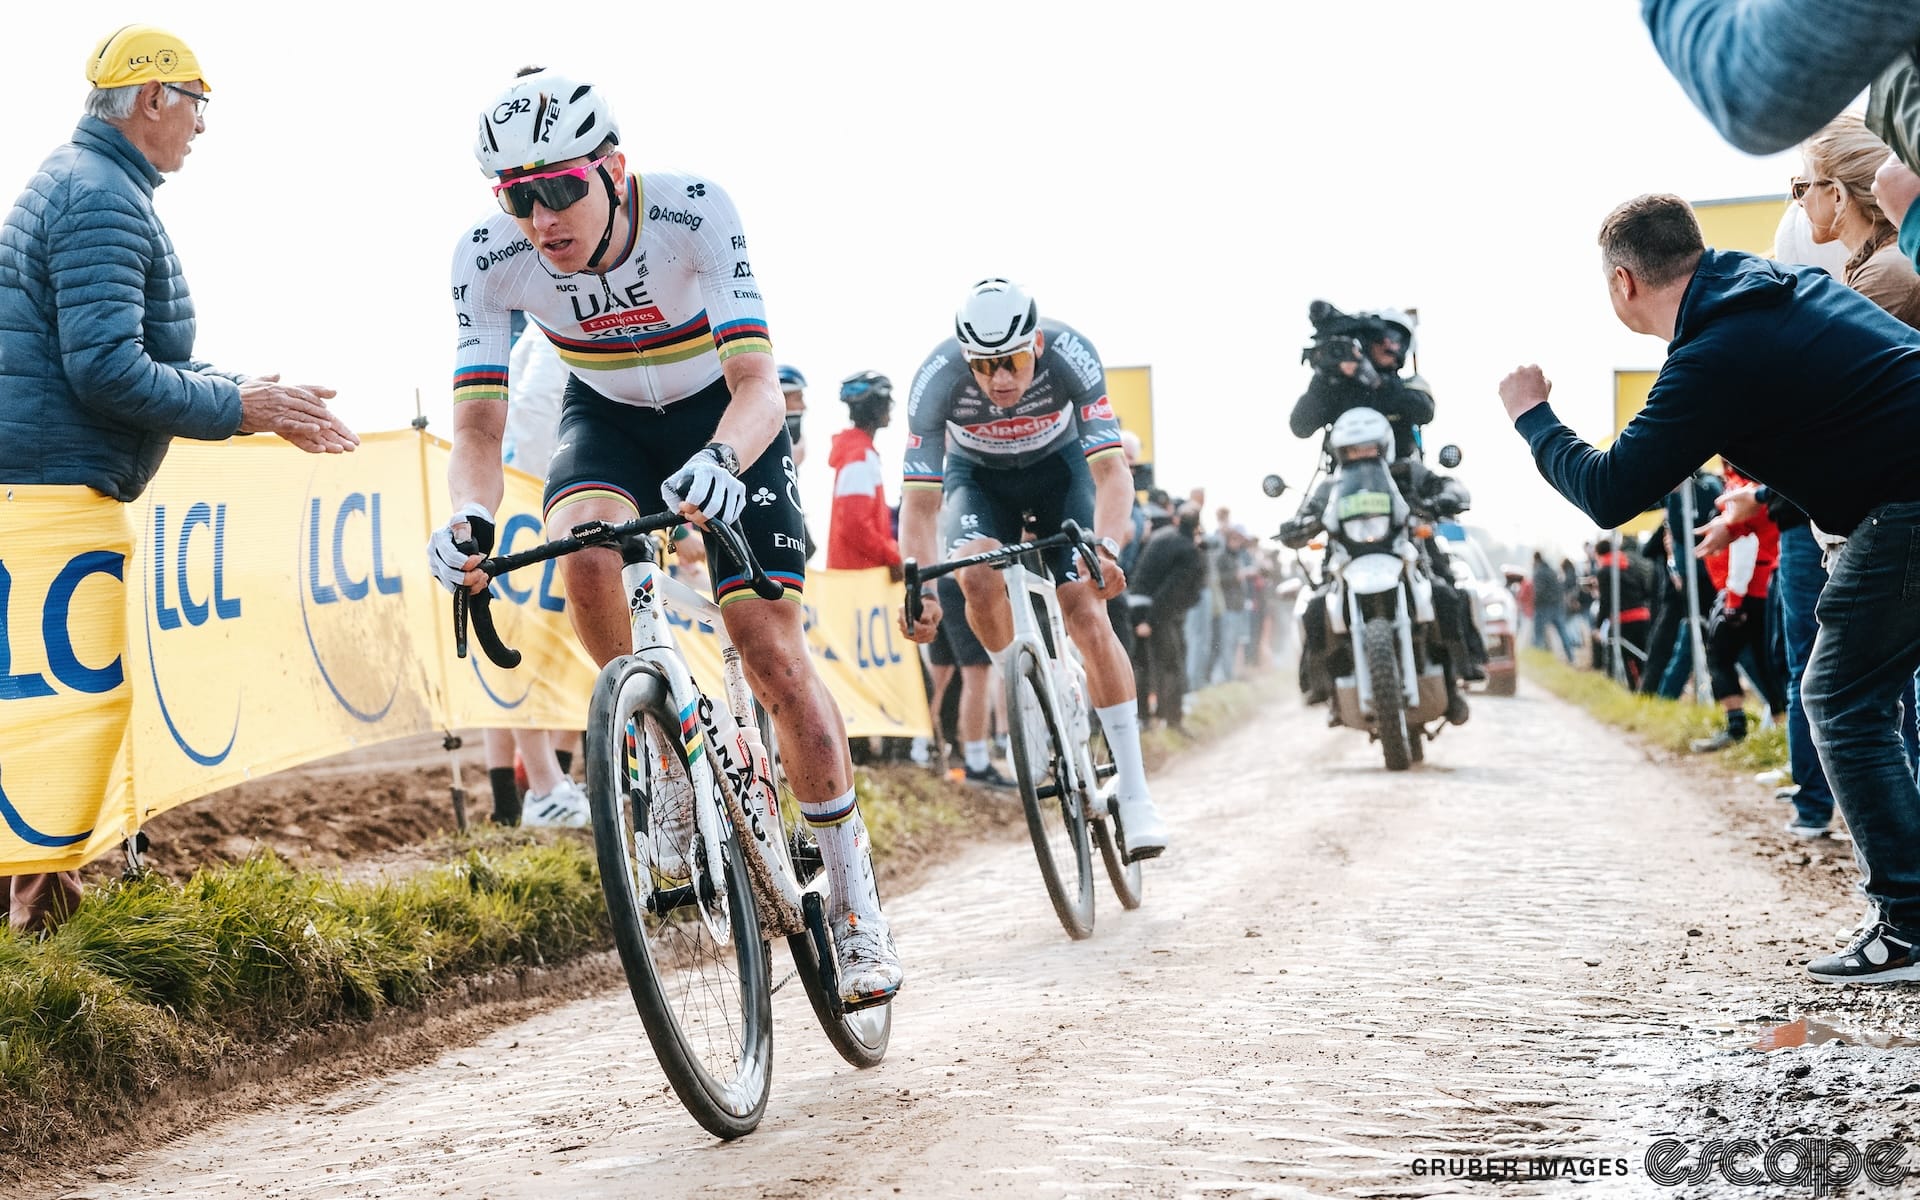
Paris-Roubaix
Key Stats
Distance: 259.2 km
Elevation gain: 1,400 metres
Elevation gain per 100 km: 540 m
Fastest edition: 2024 (47.8 km/h)
The Hell of the North, as it is affectionately known, is a firm fan favourite on the calendar. What it lacks in elevation, it more than makes up for with some of the most demanding stretches of pavé that northern France (or anywhere, really) has to offer. Although 10 km shorter than Flanders this year, Roubaix was packed with 52 km of cobbles.
Much like Flanders, the fight to be towards the front, out of harm and able to pick your line through each sector, is enough to spark some of the most aggressive riding on the calendar. Pair this with the brutality of riding cobbles at 50 km/h, and you have the recipe for a tough day out.
Without the elevation to facilitate separation, you would think Roubaix would be a race finished in a group canter to the line. In the past, Roubaix has seen slightly larger groups head to the velodrome together; however, since 2017, the race has either been won solo or in a two-up sprint. In this period, the race has been characterised by a solo long-range attack.
Liége-Bastogne-Liége
Key Stats
Distance: 252 km
Elevation gain: 4,200 metres
Elevation gain per 100 km: 1,666 m
Fastest edition: 2025 (41.98 km/h)
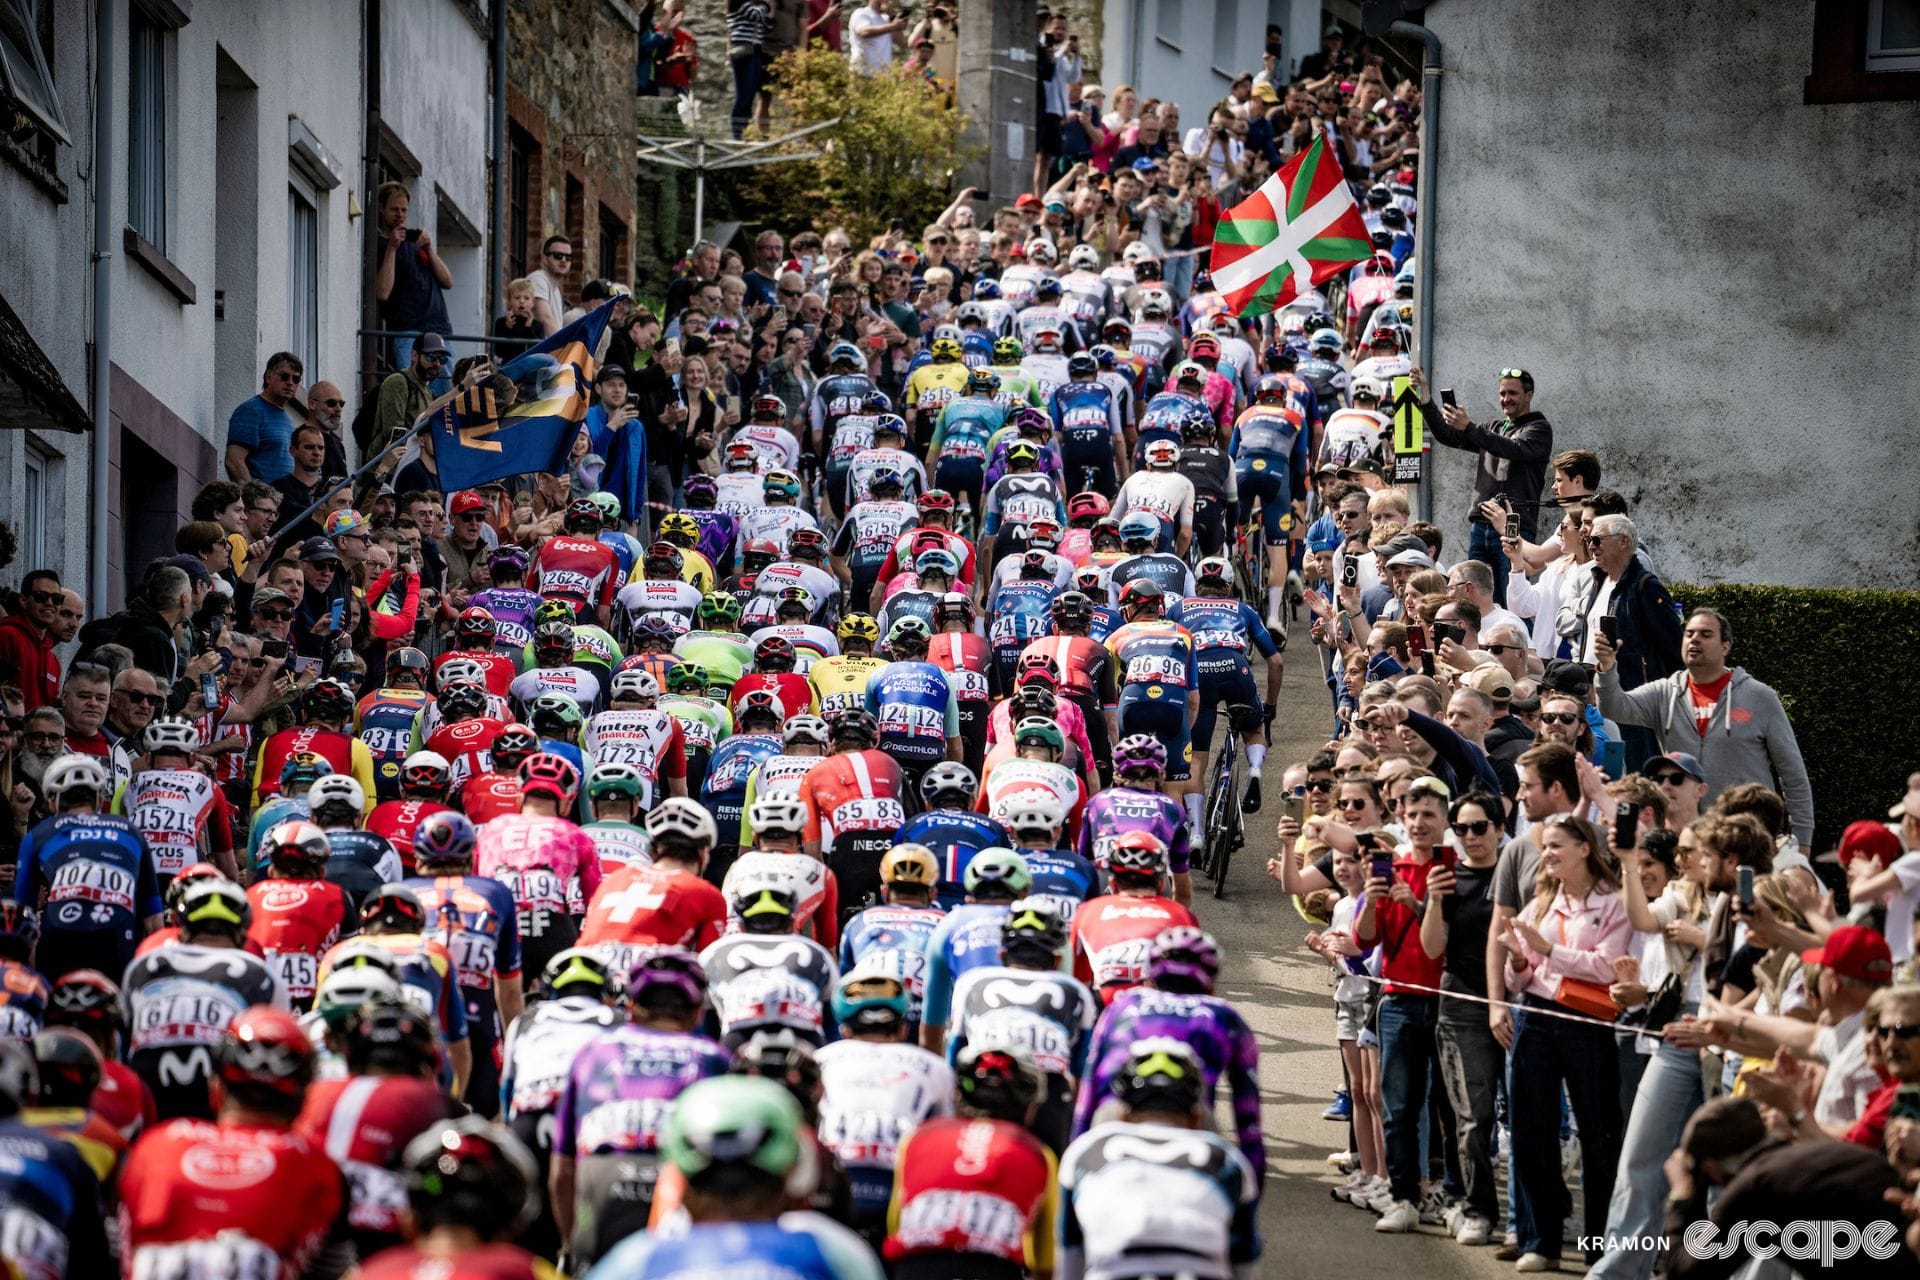
La Doyenne, or the old lady, is the oldest race on this list, sporting a rich history stretching back to 1892. It is also the first race on the list to forego cobbles, instead favouring brutally punishing elevation gain. At 252 km, it is around the same length as the other contenders but packs an almighty punch. It might favour the flyweights of the peloton, but Liége hits like a heavyweight.
With almost 4,500 metres of climbing, Liége is one for the punchy climbers of the peloton. No single climb gains more than 260 metres, with most gaining closer to 100 metres. It is a brutal assault on the ability of a rider to resist fatigue. It might not have the same fight for position as Flanders or Roubaix, but until the race settles into its natural order and things begin to thin out, there is still a battle for position, especially charging into the infamous Col du La Redoute.
Tight, technical descents are all you get for recovery, with the duration between the climbs often less than the time spent on them. It might not command the same viewer attention as the cobbled Monuments, but based on the numbers, Liége deserves its place in the shortlist.
Il Lombardia
Key Stats
Distance: 255 km
Elevation gain: 4,800 metres
Elevation gain per 100 km: 1,882
Fastest edition: 2024 (41.9 km/h)
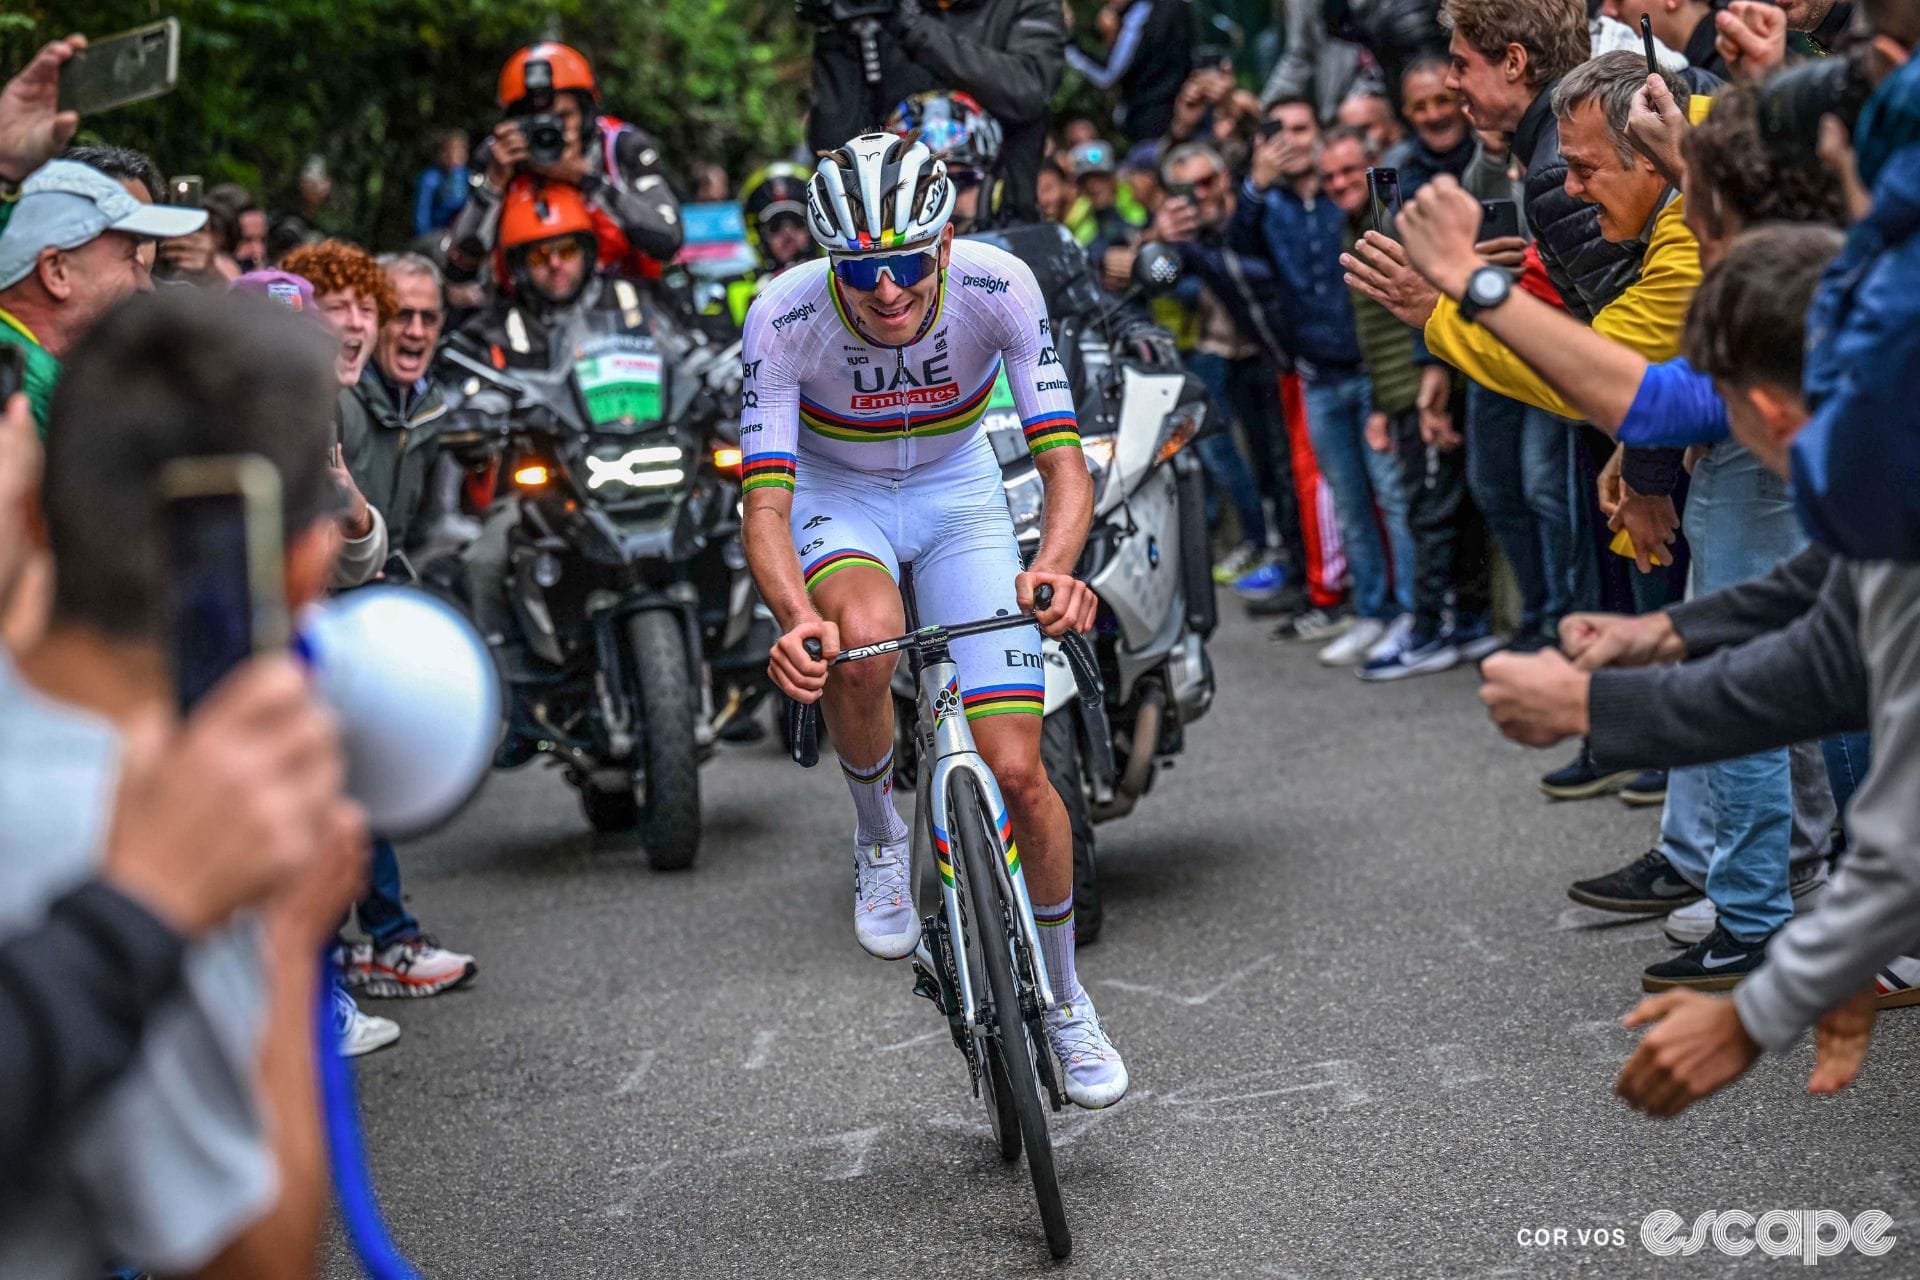
The race of the falling leaves is seen as the last major race of the season and takes place around Lake Como in Northern Italy. If there is one thing this race has plenty of, it is elevation. Pushing perilously close to 5,000 metres of elevation gain, Il Lombardia has more elevation than most Grand Tour "queen" mountain stages.
Eight main climbs create a profile that resembles an antique saw blade (the route direction alternates each year but the climbs are largely the same). The most prominent climb in the 2024 edition was the Colma di Sormano, a 13.1-kilometre climb that ascends 855 metres. The race is unlike any other on the shortlist, and although it packs a comparable amount of elevation as Liége, the two races couldn’t be further apart in how this is achieved.
World Championships
Key Stats (avg last 5 editions)
Distance: 267.7 km
Elevation gain: 3,751 metres
Elevation gain per 100 km: 1,405 m
Fastest edition: N/A (different courses make comparison impossible)
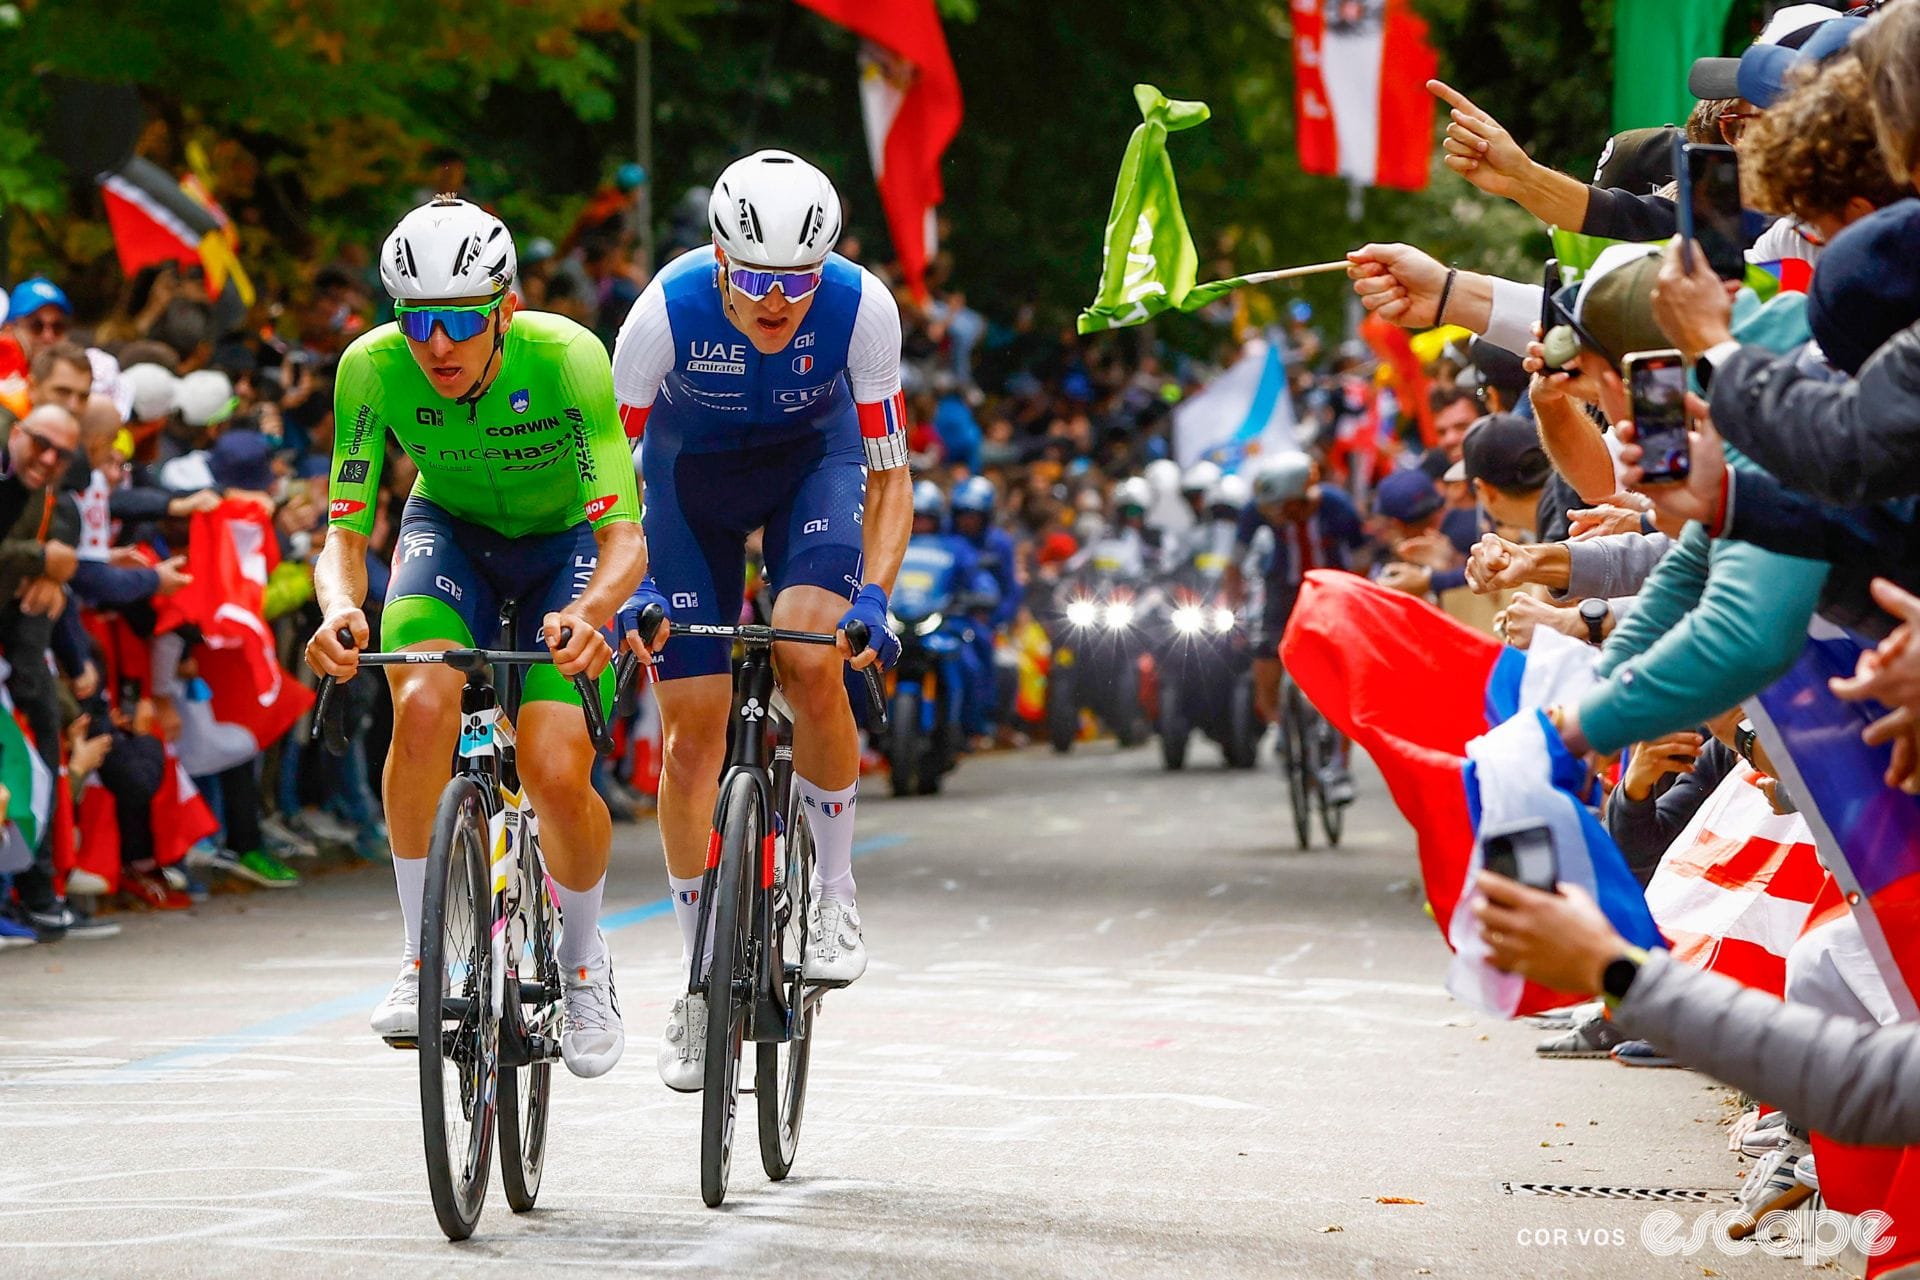
It's far from straightforward to include this on the list simply because the course of any given World Champs can vary so much. The 2011 edition in Copenhagen, for example, wouldn't be anywhere near contention for this shortlist. The 2024 race, in contrast, took place in and around Zurich and has a rightful claim to this accolade. Because courses vary, for this analysis, we've taken the average of the last five editions of the race, which ranged from 258.2 km to 273.9 km in length and featured from 2,250 metres to 4,662 metres of climbing.
World Championship road races are often longer than almost any other race in the season (except Milan-San Remo), and their location on the calendar also means that the weather is far more temperamental, depending on where in the world they are being held (few will forget the rain-soaked Harrogate edition of 2019).
In 2024, the Zurich course used the Witikon climb. The short but steep climb kept rearing its head like a recurring nightmare. Seven separate ascents of the climb pushed the race's elevation above 4,000 metres, and with a different team format than every other race of the year, it can quickly become a case of every man for himself.
How do you measure 'hardest', I hear you ask?
All shortlisted candidates may be one-day races, but this is like comparing two things and concluding they are both food. Sure, they fit nicely in the same category, but comparing Roubaix to Lombardia is like trying to decide if Belgian Waffles or Pizza are better.
There is no nicely packaged way of defining which of these races truly is the hardest. Instead, I aim to break down each race into categories based on publicly available rider data. Each of these categories will receive a ranking from 1-5; the race with the highest power, most elevation, etc, will receive a score of 5, down to the last place, which will receive a single point.
Like what you're reading? We love to hear it; please consider helping us make it happen. Escape Collective is 100% membership-funded, with no advertising and no affiliate links in our product reviews. Our work is only possible through your support.
Rider data alone should answer which is the hardest race on paper, but will those findings get thrown out the window when the pros share their thoughts on what they think the hardest one-day race is?
To give the fullest and most well-rounded comparison, the following data will be analysed:
- Average power
- Normalised power
- The delta between the two as a percentage
- Kilojoules
- Training Stress Score (TSS)
- TSS per hour
- Peak 2-, 5- and 20-minute powers
- Number of rainy editions in the past 20 years
- Elevation gain per 100 km
With such little rider data available, I am also looking back over the past three editions of each race. This should help smooth out anomalies and show, on average, which race is tougher according to each metric. It still isn't a perfect solution, but it is the best we can do with the available data.
Did we do a good job with this story?